
Chapter 21: Logging and Monitoring Systems
Chapter Objectives
- Understand the importance of logging in embedded systems development.
- Learn about the ESP-IDF logging library (
esp_log.h). - Understand the different log levels (Error, Warning, Info, Debug, Verbose) and their usage.
- Learn how to use log tags to categorize messages.
- Configure log output destinations (e.g., UART).
- Control log verbosity at compile-time and runtime.
- Interpret log message format (timestamps, core ID).
- Utilize logging effectively for debugging and monitoring applications.
Introduction
In the previous chapters, we’ve learned how to write code, manage tasks, handle GPIOs, and interact with the ESP32’s core features. However, even the most carefully crafted code can encounter unexpected issues or behave differently than intended. When things go wrong, or when we simply want to understand what our application is doing internally, we need a way to observe its execution. This is where logging comes in.
Logging is the practice of recording events, status messages, or variable values from within a running program. For embedded systems like the ESP32, which often lack traditional displays or complex debugging interfaces during normal operation, logging via a serial port (like UART) is one of the most fundamental and indispensable tools for debugging, monitoring, and tracing program flow.
This chapter introduces the ESP-IDF’s built-in logging library, a flexible and powerful system for generating informative messages from your application. Mastering its use will significantly improve your ability to develop, debug, and maintain robust ESP32 firmware.
Theory
Why Logging?
Effective logging serves several critical purposes:
- Debugging: Identifying the cause of errors or unexpected behavior by observing the sequence of events and variable states leading up to the issue.
- Monitoring: Observing the normal operation of the system, tracking key events, or measuring performance metrics during runtime.
- Tracing: Following the execution path of the code to understand how different parts of the application interact.
- Post-mortem Analysis: Analyzing logs recorded (potentially to flash or a remote system) after a crash or failure to understand what happened.
The ESP-IDF Logging Library (esp_log.h)
ESP-IDF provides a standardized logging library, primarily accessed through the esp_log.h header file. It offers several key features:
- Log Levels: Categorize messages by severity.
- Log Tags: Identify the source or component generating the message.
- Compile-time Filtering: Exclude less severe log messages from the compiled binary to save code size and improve performance.
- Runtime Filtering: Change the verbosity of logging for specific components without recompiling.
- Formatted Output: Similar to
printf, allowing variables and expressions to be included in log messages. - Timestamping: Automatically prepend timestamps to messages.
- Core ID: Indicate which CPU core (on dual-core ESP32s) generated the message.
Log Levels
The logging library defines five standard severity levels. Using the appropriate level helps filter messages and quickly identify critical issues. The levels, in order of decreasing severity, are:
- Error (
E): Critical errors that prevent normal operation or indicate a significant failure (e.g., failed memory allocation, peripheral initialization error). UseESP_LOGE(). - Warning (
W): Potential issues or unexpected conditions that might not be critical but should be investigated (e.g., configuration mismatch, resource nearing limit). UseESP_LOGW(). - Info (
I): General informational messages about the system’s state or significant events during normal operation (e.g., WiFi connected, task started, configuration loaded). UseESP_LOGI(). - Debug (
D): Detailed information useful for debugging specific functions or modules (e.g., variable values at specific points, function entry/exit). UseESP_LOGD(). - Verbose (
V): Highly detailed, often high-frequency messages for fine-grained tracing (e.g., loop iterations, raw data dumps). UseESP_LOGV().
ESP-IDF Log Levels (Highest to Lowest Severity)
| Level | Macro | Description & Use Case |
|---|---|---|
| Error (E) | ESP_LOGE() |
Critical errors indicating system failure or inability to proceed normally (e.g., memory allocation failed, hardware initialization error, unrecoverable state). Requires immediate attention. |
| Warning (W) | ESP_LOGW() |
Potential issues or unexpected situations that don’t necessarily stop operation but might lead to problems later (e.g., configuration mismatch, resource running low, timeout occurred but recovered). Should be investigated. |
| Info (I) | ESP_LOGI() |
General informational messages about major lifecycle events or state changes during normal operation (e.g., Task started, WiFi connected, System initialized, Configuration loaded). Useful for high-level monitoring. |
| Debug (D) | ESP_LOGD() |
Detailed information useful primarily during development and debugging (e.g., function entry/exit points, specific variable values, state transitions within a module). Typically disabled in release builds. |
| Verbose (V) | ESP_LOGV() |
Highly detailed, potentially high-frequency messages for fine-grained tracing (e.g., loop iterations, raw data packets, individual byte processing). Almost always disabled in release builds due to performance impact. |
Log Tags
Every log message generated using the standard macros is associated with a “tag”. A tag is simply a string (typically short and uppercase) that identifies the module, component, or specific part of the code generating the message.
- Purpose: Tags allow you to easily filter messages from specific parts of your application or the underlying ESP-IDF framework.
- Definition: Tags are usually defined as static constant character pointers at the beginning of a
.cfile:#include "esp_log.h" static const char *TAG = "MY_APP"; // Define the tag for this file - Usage: The tag is passed as the first argument to the logging macros:
ESP_LOGI(TAG, "Initialization complete."); ESP_LOGE(TAG, "Failed to initialize sensor %d", sensor_id);
Logging Macros
The primary way to generate log messages is through the ESP_LOGx macros, where x corresponds to the log level:
ESP_LOGE(tag, format, ...): Log an Error message.ESP_LOGW(tag, format, ...): Log a Warning message.ESP_LOGI(tag, format, ...): Log an Info message.ESP_LOGD(tag, format, ...): Log a Debug message.ESP_LOGV(tag, format, ...): Log a Verbose message.
These macros function similarly to printf, accepting a format string and a variable number of arguments.
Log Output
By default, log messages are sent to the primary UART interface (usually UART0), which is connected to the USB-to-Serial chip on most development boards. This allows you to view the logs using a serial monitor program (like the one integrated into VS Code, idf.py monitor, PuTTY, or screen).
Other output destinations can be configured (e.g., writing to flash, sending over network, JTAG), but UART is the most common for development and debugging.
Controlling Log Verbosity
The level of detail in the log output can be controlled both at compile-time and runtime.
1. Compile-Time Log Level (CONFIG_LOG_MAXIMUM_LEVEL)
- Location:
Component config->Log output->Maximum log verbosityinmenuconfig. - Function: Sets the maximum log level that will be included in the compiled firmware binary. Any log macro call with a severity lower than this level will be completely removed by the preprocessor.
- Example: If set to
Info, calls toESP_LOGD()andESP_LOGV()will be stripped out. Calls toESP_LOGE(),ESP_LOGW(), andESP_LOGI()will be included. - Purpose: Reduces code size and improves performance by removing unnecessary logging code in production builds. For development,
DebugorVerbosemight be useful. For release,InfoorWarningis common.
2. Runtime Log Level
- Location:
Component config->Log output->Default log verbosityinmenuconfig. - Function: Sets the default verbosity level applied at startup. Messages with severity less than or equal to this level will be printed, provided they weren’t stripped out at compile time.
- Dynamic Control: The verbosity level for specific tags can be changed at runtime using the
esp_log_level_set(tag, level)function.tag: The string tag to change the level for (e.g., “MY_APP”). Use"*"to set the default level for all tags not explicitly set otherwise.level: Anesp_log_level_tenum value (ESP_LOG_NONE,ESP_LOG_ERROR,ESP_LOG_WARN,ESP_LOG_INFO,ESP_LOG_DEBUG,ESP_LOG_VERBOSE).
- Purpose: Allows you to dynamically increase or decrease the detail of logging for specific components while the application is running, without needing to recompile and reflash. This is extremely useful for targeted debugging.
flowchart TD
%% Theme Configuration
%%{ init: {
'theme': 'base',
'themeVariables': {
'primaryColor': '#DBEAFE',
'primaryTextColor': '#1E40AF',
'primaryBorderColor': '#2563EB',
'lineColor': '#A78BFA',
'textColor': '#1F2937',
'mainBkg': '#FFFFFF',
'nodeBorder': '#A78BFA',
'fontFamily': '"Open Sans", sans-serif'
}
} }%%
%% Source Code Subgraph
subgraph SourceCode["Source Code"]
direction LR
L_E["ESP_LOGE(TAG, ...)"]:::logError
L_W["ESP_LOGW(TAG, ...)"]:::logWarn
L_I["ESP_LOGI(TAG, ...)"]:::logInfo
L_D["ESP_LOGD(TAG, ...)"]:::logDebug
L_V["ESP_LOGV(TAG, ...)"]:::logVerbose
end
%% Compile-Time Filtering Subgraph
subgraph CompileTime["Compile-Time Filtering"]
direction TB
CT_Filter{"Compile-Time Check<br>(CONFIG_LOG_MAXIMUM_LEVEL)"}:::decisionNode
end
%% Runtime Filtering Subgraph
subgraph RuntimeFilter["Runtime Filtering"]
direction TB
RT_Filter{"Runtime Check<br>(esp_log_level_get(TAG) or Default)"}:::decisionNode
end
%% Output Subgraph
subgraph OutputArea["Output"]
Output["Log Output (e.g., UART)"]:::endNode
end
%% Connections
L_E --> CT_Filter
L_W --> CT_Filter
L_I --> CT_Filter
L_D --> CT_Filter
L_V --> CT_Filter
CT_Filter -- "Level <= Max Level?<br>(e.g., Max = INFO)" --> RT_Filter
CT_Filter -- "Level > Max Level?<br>(e.g., D, V)" --> Stripped["Code Stripped Out<br>(Not in Binary)"]:::strippedNode
RT_Filter -- "Level <= Runtime Level?<br>(e.g., Runtime = DEBUG for TAG)" --> Output
RT_Filter -- "Level > Runtime Level?<br>(e.g., V)" --> Discarded["Message Discarded"]:::discardNode
%% Class Definitions
classDef logError fill:#FEE2E2,stroke:#DC2626,stroke-width:1px,color:#991B1B
classDef logWarn fill:#FEF3C7,stroke:#D97706,stroke-width:1px,color:#92400E
classDef logInfo fill:#DBEAFE,stroke:#2563EB,stroke-width:1px,color:#1E40AF
classDef logDebug fill:#D1FAE5,stroke:#059669,stroke-width:1px,color:#065F46
classDef logVerbose fill:#F3F4F6,stroke:#6B7280,stroke-width:1px,color:#374151
classDef decisionNode fill:#FEF9C3,stroke:#F59E0B,stroke-width:1.5px,color:#B45309,fontWeight:bold
classDef strippedNode fill:#FECACA,stroke:#EF4444,stroke-width:1px,color:#991B1B
classDef discardNode fill:#FEF3C7,stroke:#D97706,stroke-width:1px,color:#92400E
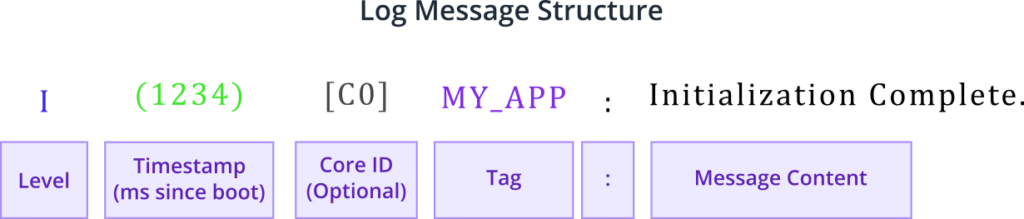
classDef endNode fill:#D1FAE5,stroke:#059669,stroke-width:2px,color:#065F46Log Message Format
A typical log message output to the UART looks like this:
I (1234) MY_APP: Initialization complete.
W (1238) WIFI: WiFi channel set to 6
E (1245) SENSOR: Failed to read sensor ID=2, error=-1
Let’s break down the components:
I,W,E: The log level indicator (Info, Warning, Error).(1234): Timestamp in milliseconds since boot. Configurable via menuconfig (Component config->Log output->Add timestamp to log output).MY_APP,WIFI,SENSOR: The log tag.:: Separator.Initialization complete.,WiFi channel set to 6, etc.: The actual log message content.
On dual-core ESP32 variants (like the original ESP32, ESP32-S3), the core ID might also be included if enabled in menuconfig (Component config -> Log output -> Add core ID to log output):
I (1234) [C0] MY_APP: Initialization complete on Core 0
I (1235) [C1] OTHER_TASK: Task started on Core 1
[C0],[C1]: Indicates the message originated from Core 0 or Core 1, respectively.
Practical Examples
Project Setup:
- Use a standard ESP-IDF project template (like
hello_world). - Ensure you have VS Code with the ESP-IDF extension set up.
- No additional hardware is needed beyond your ESP32 development board connected via USB.
Common Includes:
Ensure these includes are present at the top of your main C file (e.g., main/hello_world_main.c):
#include <stdio.h>
#include "freertos/FreeRTOS.h"
#include "freertos/task.h"
#include "esp_log.h" // Include the logging library header
#include "sdkconfig.h" // Required for accessing menuconfig settings like CONFIG_LOG_MAXIMUM_LEVEL
Example 1: Basic Logging
This example demonstrates using different log levels and tags.
#include <stdio.h>
#include "freertos/FreeRTOS.h"
#include "freertos/task.h"
#include "esp_log.h"
#include "sdkconfig.h"

// Define tags for different "modules"
static const char *TAG_MAIN = "MAIN_APP";
static const char *TAG_NETWORK = "NETWORK";
static const char *TAG_SENSOR = "SENSOR";

void app_main(void)
{
    ESP_LOGI(TAG_MAIN, "Application starting...");

    // Simulate network initialization
    ESP_LOGI(TAG_NETWORK, "Initializing network connection...");
    vTaskDelay(pdMS_TO_TICKS(500)); // Simulate work
    ESP_LOGD(TAG_NETWORK, "Socket created.");
    vTaskDelay(pdMS_TO_TICKS(500));
    ESP_LOGW(TAG_NETWORK, "Weak WiFi signal detected.");
    vTaskDelay(pdMS_TO_TICKS(500));
    ESP_LOGI(TAG_NETWORK, "Network connection established.");

    // Simulate sensor reading
    ESP_LOGI(TAG_SENSOR, "Initializing sensor...");
    vTaskDelay(pdMS_TO_TICKS(300));
    ESP_LOGV(TAG_SENSOR, "Reading register 0x0A..."); // Very detailed
    vTaskDelay(pdMS_TO_TICKS(100));
    ESP_LOGE(TAG_SENSOR, "Failed to communicate with sensor!");

    ESP_LOGI(TAG_MAIN, "Initialization sequence finished.");

    int counter = 0;
    while(1) {
        ESP_LOGI(TAG_MAIN, "Main loop iteration %d", counter++);
        // Only log debug message every 5 iterations
        if (counter % 5 == 0) {
             ESP_LOGD(TAG_MAIN, "Debug check point reached.");
        }
        vTaskDelay(pdMS_TO_TICKS(2000)); // Run every 2 seconds
    }
}
Build, Flash, and Monitor:
- Configure Log Levels (menuconfig):
- Open the VS Code terminal (
Terminal>New Terminal). - Run
idf.py menuconfig. - Navigate to
Component config->Log output. - Set
Maximum log verbositytoVerbose(to ensure no messages are compiled out). - Set
Default log verbositytoInfo. - Save and exit menuconfig.
- Open the VS Code terminal (
- Build: Run
idf.py build. - Flash: Run
idf.py -p <YOUR_PORT> flash(replace<YOUR_PORT>with your ESP32’s serial port, e.g.,/dev/ttyUSB0orCOM3). - Monitor: Run
idf.py -p <YOUR_PORT> monitor.
Expected Output (with Default Level = Info):
You should see messages with levels I, W, and E. Messages logged with ESP_LOGD and ESP_LOGV will not appear initially because the default runtime level is Info.
I (xxx) MAIN_APP: Application starting...
I (xxx) NETWORK: Initializing network connection...
W (xxx) NETWORK: Weak WiFi signal detected.
I (xxx) NETWORK: Network connection established.
I (xxx) SENSOR: Initializing sensor...
E (xxx) SENSOR: Failed to communicate with sensor!
I (xxx) MAIN_APP: Initialization sequence finished.
I (xxx) MAIN_APP: Main loop iteration 0
I (xxx) MAIN_APP: Main loop iteration 1
...
Example 2: Setting Log Levels Dynamically
This example shows how to change the log level for specific tags at runtime. We’ll modify the previous example to enable Debug logs for the NETWORK tag after a few seconds.
#include <stdio.h>
#include "freertos/FreeRTOS.h"
#include "freertos/task.h"
#include "esp_log.h"
#include "sdkconfig.h"

static const char *TAG_MAIN = "MAIN_APP";
static const char *TAG_NETWORK = "NETWORK";
static const char *TAG_SENSOR = "SENSOR";

void app_main(void)
{
    ESP_LOGI(TAG_MAIN, "Application starting...");
    ESP_LOGI(TAG_MAIN, "Current default log level likely Info or Debug (check menuconfig).");
    ESP_LOGI(TAG_MAIN, "Network debug messages should be initially hidden if default is Info.");

    // Simulate network initialization (with Debug messages)
    ESP_LOGI(TAG_NETWORK, "Initializing network connection...");
    vTaskDelay(pdMS_TO_TICKS(500));
    ESP_LOGD(TAG_NETWORK, "Socket created."); // Initially hidden if default=Info
    vTaskDelay(pdMS_TO_TICKS(500));
    ESP_LOGW(TAG_NETWORK, "Weak WiFi signal detected.");
    vTaskDelay(pdMS_TO_TICKS(500));
    ESP_LOGI(TAG_NETWORK, "Network connection established.");

    // Simulate sensor reading
    ESP_LOGI(TAG_SENSOR, "Initializing sensor...");
    vTaskDelay(pdMS_TO_TICKS(300));
    ESP_LOGV(TAG_SENSOR, "Reading register 0x0A..."); // Initially hidden
    vTaskDelay(pdMS_TO_TICKS(100));
    ESP_LOGE(TAG_SENSOR, "Failed to communicate with sensor!");

    ESP_LOGI(TAG_MAIN, "Initialization sequence finished.");
    ESP_LOGI(TAG_MAIN, "Waiting 5 seconds before enabling DEBUG for NETWORK tag...");
    vTaskDelay(pdMS_TO_TICKS(5000));

    // --- Change log level for NETWORK tag ---
    ESP_LOGW(TAG_MAIN, "Setting log level for tag '%s' to DEBUG", TAG_NETWORK);
    esp_log_level_set(TAG_NETWORK, ESP_LOG_DEBUG);
    ESP_LOGD(TAG_NETWORK, "This NETWORK debug message should now be visible.");
    ESP_LOGV(TAG_NETWORK, "This NETWORK verbose message is still hidden (level is DEBUG).");

    // --- Change log level for all tags (*) ---
    ESP_LOGW(TAG_MAIN, "Setting default log level for '*' to VERBOSE");
    esp_log_level_set("*", ESP_LOG_VERBOSE);
    ESP_LOGV(TAG_SENSOR, "This SENSOR verbose message should now be visible.");
    ESP_LOGV(TAG_MAIN, "This MAIN verbose message should now be visible.");


    int counter = 0;
    while(1) {
        ESP_LOGI(TAG_MAIN, "Main loop iteration %d", counter++);
        if (counter % 5 == 0) {
             ESP_LOGD(TAG_MAIN, "Debug check point reached."); // Visible now
        }
        vTaskDelay(pdMS_TO_TICKS(2000));
    }
}
Build, Flash, and Monitor:
- Configure Log Levels (menuconfig):
- Ensure
Maximum log verbosityis stillVerbose. - Keep
Default log verbosityatInfo. - Save and exit.
- Ensure
- Build, Flash, Monitor: Use
idf.py build,idf.py flash,idf.py monitor.
Expected Output:
- Initially, only
I,W,Emessages appear. TheESP_LOGD(TAG_NETWORK, "Socket created.")message is not shown. - After the 5-second delay and the
esp_log_level_set(TAG_NETWORK, ESP_LOG_DEBUG)call, the log messageD (xxx) NETWORK: This NETWORK debug message should now be visible.will appear. FutureESP_LOGDmessages with theNETWORKtag would also appear. - After the
esp_log_level_set("*", ESP_LOG_VERBOSE)call, all subsequent messages (includingVandDlevels for any tag) will appear, such as the verbose messages forSENSORandMAIN, and the periodic debug message in the main loop.
Example 3: Customizing Log Output Format (via menuconfig)
This isn’t a code example, but demonstrates configuration.
- Run
idf.py menuconfig. - Navigate to
Component config->Log output. - Explore the options:
Add timestamp to log output: Toggle timestamps (e.g.,(1234)).Add core ID to log output: Toggle core ID (e.g.,[C0]).Enable colors in log output: Adds ANSI color codes to the output, making levels visually distinct in terminals that support color. Try enabling this!
- Change a setting (e.g., enable colors).
- Save and exit.
- Rebuild, Flash, and Monitor:
idf.py build flash monitor.
Expected Output (with Colors Enabled):
If your terminal supports ANSI colors, you will now see log messages colored by severity (e.g., Errors in red, Warnings in yellow, Info default, Debug/Verbose maybe blue/gray).
// Example with colors enabled (actual colors depend on terminal)
I (xxx) MAIN_APP: Application starting...
W (xxx) NETWORK: Weak WiFi signal detected.  // Likely Yellow
E (xxx) SENSOR: Failed to communicate with sensor! // Likely Red
Variant Notes
The ESP-IDF logging library (esp_log.h) and its configuration via menuconfig are consistent across all ESP32 variants supported by ESP-IDF v5.x (including ESP32, ESP32-S2, ESP32-S3, ESP32-C3, ESP32-C6, ESP32-H2).
- Core ID: The
Add core ID to log outputoption in menuconfig is primarily relevant for dual-core variants (ESP32, ESP32-S3) but doesn’t cause issues on single-core variants (it simply won’t add a core ID if there’s only one). - Performance: Logging, especially at
Verboselevels or within tight loops, does consume CPU time and can impact real-time performance. This impact is generally similar across variants, though the absolute timing might differ based on clock speed.
Common Mistakes & Troubleshooting Tips
| Mistake / Issue | Symptom(s) | Troubleshooting / Solution |
|---|---|---|
| Messages Not Appearing (Compile-Time Filter) Detailed logs missing despite runtime settings. |
ESP_LOGD/ESP_LOGV calls produce no output. |
Increase Maximum log verbosity in menuconfig (Component config -> Log output) to Debug or Verbose. Rebuild & reflash. Note: increases code size. |
| Messages Not Appearing (Runtime Filter) Compiled-in logs missing based on current level. |
Debug/Verbose messages are not printed when expected. | Use esp_log_level_set(TAG, level) to lower the filter level for a tag (or "*" for default). Or, lower Default log verbosity in menuconfig (requires rebuild/reflash). |
Using printf instead of ESP_LOGxBypassing the logging framework. |
Messages lack level, timestamp, tag. Cannot be filtered by level/tag via framework tools. | Use standard ESP_LOGx macros. Define a static const char *TAG = "..."; and pass it as the first argument. |
| Inconsistent or Missing Tags Using generic or no tags. |
Difficult to filter logs from specific modules. Runtime level control is less effective. | Define a unique, descriptive TAG for each C file or logical module. Use it consistently. |
| Excessive Logging in Critical Code Detailed logging in loops, ISRs, etc. |
Application slowdown, missed deadlines, instability, especially with ESP_LOGV/ESP_LOGD. |
Minimize logging in time-sensitive code. Use higher severity levels (I/W/E), log summaries, or use conditional logging. Use compile-time filtering for release builds. |
| No Output in Serial Monitor Monitor window remains blank. |
Blank monitor window after flashing/resetting. | Verify correct serial port (-p PORT). Check USB cable & board power. Ensure monitor baud rate matches ESP32 (usually 115200, handled by idf.py monitor). Reset board. Check UART pin configuration if custom. |
Exercises
- Conditional Logging: Modify Example 1. Add a global boolean variable
g_detailed_logging_enabled, initialized tofalse. In the main loop, only print theESP_LOGD(TAG_MAIN, "Debug check point reached.")message ifg_detailed_logging_enabledistrue. Add logic (e.g., triggered by a button press if you completed Chapter 20’s exercises, or just after a delay) to setg_detailed_logging_enabledtotrue. Observe how the debug message only appears after the flag is set. - Log Level Control Task: Create a separate FreeRTOS task. Inside this task’s loop, cycle through setting the log level for the
TAG_MAINtag (from Example 1 or 2) toESP_LOG_INFO,ESP_LOG_DEBUG, andESP_LOG_VERBOSEusingesp_log_level_set(), waiting perhaps 10 seconds between each change. Observe how the output from theapp_mainloop changes its verbosity over time based on the settings applied by the control task. - Investigate ESP-IDF Logs: Run Example 1 or 2 again, but this time set the default log level (
*) toVerboseusingesp_log_level_set("*", ESP_LOG_VERBOSE);right at the beginning ofapp_main. Observe the large amount of output generated by the underlying ESP-IDF components (likewifi,event,tcpip_adapter,freertos). Try to identify messages related to system startup, task creation, and potentially WiFi initialization if WiFi was enabled by default in your project configuration. This demonstrates how logging helps inspect the framework’s behavior.
Summary
- Logging is essential for debugging, monitoring, and understanding ESP32 application behavior.
- ESP-IDF provides a powerful logging library via
esp_log.h. - Use
ESP_LOGE,ESP_LOGW,ESP_LOGI,ESP_LOGD,ESP_LOGVmacros for different severity levels. - Assign a unique
TAGto each module/file for message filtering. - Log verbosity can be controlled at compile-time (
Maximum log verbosity) and runtime (Default log verbosity,esp_log_level_set()). - Default log output is via UART, viewable with a serial monitor.
- Log messages typically include level, timestamp, tag, and the message content. Core ID can also be included.
- Use appropriate log levels and avoid excessive logging in performance-critical code.
Further Reading
- ESP-IDF Programming Guide – Logging: https://docs.espressif.com/projects/esp-idf/en/v5.4/esp32/api-reference/system/log.html (Essential reference for API details and configuration options).
- ESP-IDF Programming Guide – Error Handling: https://docs.espressif.com/projects/esp-idf/en/v5.4/esp32/api-guides/error-handling.html (Related concepts for reporting issues).
