
Chapter 11: Raspberry Pi 5 Power Requirements and Management
Chapter Objectives
By the end of this chapter, you will be able to:
- Understand the specific power supply requirements for the Raspberry Pi 5 and the implications of using non-compliant power sources.
- Explain the role of the Power Management Integrated Circuit (PMIC) and the USB-C Power Delivery (PD) protocol in the Raspberry Pi 5’s power architecture.
- Implement practical methods to measure the real-time power consumption of the Raspberry Pi 5 under various workloads.
- Utilize Linux command-line tools and inspect system files to monitor and configure basic power management features.
- Diagnose and troubleshoot common power-related issues that affect system stability and performance.
- Apply fundamental power-saving techniques through software configuration.
Introduction
In the world of embedded systems, power is not merely a utility; it is a fundamental resource that dictates the boundaries of performance, stability, and operational longevity. For a device like the Raspberry Pi 5, which packs desktop-level performance into a single-board computer (SBC), managing power is a critical engineering discipline. Unlike a desktop PC tethered to a high-wattage wall outlet, an embedded system often operates under strict power budgets, whether deployed in a remote IoT sensor running on a battery, a robotics platform where every milliwatt affects endurance, or an industrial controller where thermal output is a major concern. Understanding and controlling power consumption is paramount.
This chapter transitions our focus from the logical and software layers of the system to the electrical foundation upon which everything else is built. We will explore the “why” behind the Raspberry Pi 5’s specific 27W (5V/5A) power supply recommendation, moving beyond a simple plug-and-play mentality. You will learn that the interaction between the power supply and the Raspberry Pi is an active negotiation, a dialogue managed by sophisticated hardware to ensure the system has the resources it needs to unleash its full potential. We will investigate the hardware components responsible for this dialogue, namely the dedicated Power Management Integrated Circuit (PMIC). By the chapter’s conclusion, you will not only be able to select the correct power source but also measure, monitor, and manage your Raspberry Pi 5’s power draw, transforming you from a user into a system architect who can design for efficiency and reliability in real-world applications.
Technical Background
The Foundation: Voltage, Current, and Power
Before delving into the specifics of the Raspberry Pi 5, it is essential to solidify our understanding of the fundamental electrical concepts that govern its operation. At the most basic level, we are concerned with three interrelated quantities: Voltage (V), Current (I), and Power (P).
Think of electricity flowing through a wire as water flowing through a pipe. Voltage, measured in volts (V), is analogous to the water pressure. It is the electrical potential difference that “pushes” the charged electrons through the circuit. Current, measured in amperes (A), is analogous to the flow rate of the water. It represents the volume of electrons passing a specific point in the circuit per unit of time.
Power, measured in watts (W), is the product of these two quantities and represents the actual rate at which electrical energy is being transferred or consumed by the system. The relationship is elegantly simple: Power = Voltage × Current (P = V × I). A device can achieve a high power rating through high voltage and low current, low voltage and high current, or a balance of both. For the Raspberry Pi 5, the official power supply is rated for 5.1V and 5A, which, when multiplied, gives us a power capacity of 25.5W (often rounded to 27W to include a safety margin). This simple calculation is the key to understanding why both voltage and current specifications are critically important. An insufficient voltage (low pressure) can cause the system’s components to malfunction, a condition known as a brownout. Insufficient current capacity (low flow rate) means the power supply cannot meet the demands of the CPU and peripherals, leading to instability and crashes, especially under heavy load.
The Evolution of USB Power: From Simple Supply to Intelligent Delivery
The Universal Serial Bus (USB) standard was initially conceived for data transfer, with power delivery as a secondary, low-power convenience. The original USB 1.0 and 2.0 specifications provided a meager 5V at 0.5A, totaling just 2.5W of power—enough for a mouse or keyboard, but wholly inadequate for a modern computer. As devices grew more complex, the need for more power through the convenient USB connector became apparent.
This led to the development of the USB Power Delivery (PD) specification, a protocol that transforms the USB port from a simple power source into an intelligent, negotiable power bus. Unlike the fixed-voltage, fixed-current model of its predecessors, USB-C PD allows the device (the “sink,” like a Raspberry Pi) and the power supply (the “source”) to communicate. Upon connection, they engage in a digital handshake over the USB-C cable’s Configuration Channel (CC) pins. The source advertises its capabilities—a menu of voltage and current profiles it can provide (e.g., 5V/3A, 9V/3A, 12V/2.25A). The sink then requests the profile that best suits its needs.
The Raspberry Pi 5 leverages this protocol to secure the high power it requires. When connected to a USB-C PD-compliant power supply, it specifically requests a 5V/5A profile. If the power supply confirms it can provide this, the Pi 5 unlocks its full performance potential, including raising the current limit for downstream USB peripherals to 1.6A. If the negotiation fails or a non-PD supply is used, the Pi 5 defaults to a legacy mode, limiting the current for its peripherals to a much lower 600mA to protect the potentially weaker power source and ensure its own stability. This negotiation is the reason why not all USB-C chargers are created equal in the context of the Raspberry Pi 5.
graph TD
    subgraph "USB-C PD Handshake"
        direction LR
        A[/"<b>USB-C PD Power Supply</b><br><i>(Source)</i>"/]
        B[/"<b>Raspberry Pi 5</b><br><i>(Sink)</i>"/]

        A -- "1- Advertise Capabilities<br><i>(Over CC Pin)</i><br>I can provide:<br>- 5V/3A<br>- 9V/3A<br>- <b>5V/5A</b>" --> B
        B -- "2- Request Profile<br>I require <b>5V/5A</b>" --> A
        A -- "3- Accept Request<br>Providing 5V/5A" --> C{Agreement Reached}
        C -- "Full Performance Unlocked<br>USB Current Limit: 1.6A" --> D[("✅<br><b>System Stable</b>")]

        subgraph "Alternative Path: Non-Compliant Supply"
            A -- "Advertise Capabilities<br>I can only provide 5V/3A" --> E[/"<b>Raspberry Pi 5</b><br><i>(Sink)</i>"/]
            E -- "Request 5V/5A (Fails)<br>Defaulting to legacy mode" --> F{Negotiation Failed}
            F -- "Reduced Performance<br>USB Current Limit: 600mA" --> G[("⚠️<br><b>Potential Instability</b>")]
        end
    end

    %% Styling
    style A fill:#1e3a8a,stroke:#1e3a8a,stroke-width:2px,color:#ffffff
    style B fill:#8b5cf6,stroke:#8b5cf6,stroke-width:1px,color:#ffffff
    style E fill:#8b5cf6,stroke:#8b5cf6,stroke-width:1px,color:#ffffff
    style C fill:#f59e0b,stroke:#f59e0b,stroke-width:1px,color:#ffffff
    style F fill:#f59e0b,stroke:#f59e0b,stroke-width:1px,color:#ffffff
    style D fill:#10b981,stroke:#10b981,stroke-width:2px,color:#ffffff
    style G fill:#eab308,stroke:#eab308,stroke-width:1px,color:#1f2937
The Heart of Power Management: The DA9091 PMIC
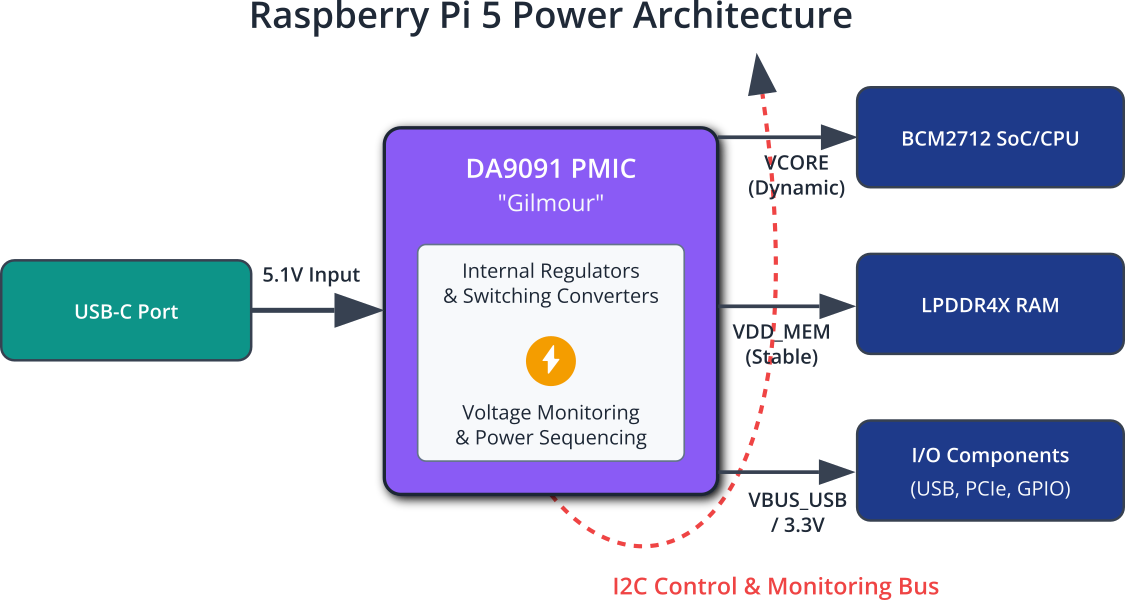
At the center of the Raspberry Pi 5’s power architecture is a highly sophisticated, dedicated chip: the Dialog Semiconductor DA9091 Power Management Integrated Circuit (PMIC). This component, often referred to as the “Gilmour” PMIC, was custom-designed for the Raspberry Pi. It acts as the central hub for distributing and regulating power throughout the entire board.
The PMIC takes the primary 5V input from the USB-C port and, through a series of internal regulators and switching converters, generates the various, precise voltage levels required by different parts of the system. The BCM2712 processor, the LPDDR4X RAM, and the various I/O components all require different, stable voltages to operate correctly. For instance, the CPU core might need a dynamically adjusted voltage (e.g., around 1.0V) that changes based on its clock speed, while the RAM requires a different, constant voltage. The PMIC is responsible for generating all of these “power rails” efficiently.
Its role extends beyond simple voltage conversion. The PMIC also monitors the system’s power state. It sequences the power-up and power-down of different components in a controlled manner, preventing damaging electrical surges. It constantly monitors the input voltage from the USB-C port. If it detects a “brownout” condition where the voltage drops below a safe threshold (approximately 4.25V), it will shut down the system to protect the hardware from damage and data corruption. This protective function is crucial for system reliability. The PMIC communicates with the main SoC (System on a Chip) via an I2C interface, allowing the operating system to query power status and, to some extent, control power management features.
System Power States and Software Control
An embedded Linux system like the Raspberry Pi 5 does not simply operate in an “on” or “off” state. Its power consumption fluctuates dramatically based on its activity level. These different levels can be thought of as informal power states.
- Idle State: When the operating system is running but no user applications are active, the CPU enters a low-power state. The clock frequency is reduced, and unused parts of the processor may be “clock-gated,” effectively paused to save power. In this state, the Pi 5 consumes a baseline amount of power, typically around 3W.
- Normal Load: During typical desktop use—browsing the web, editing text—the CPU dynamically scales its frequency up and down to meet demand. Power consumption will be variable, fluctuating based on the intensity of the tasks.
- Peak Load (Stress) State: When performing computationally intensive tasks, such as compiling software, rendering video, or running benchmarks, the CPU and other components operate at their maximum frequency and voltage. This is when the system approaches its maximum power draw. With the official 27W power supply, the Pi 5 has enough headroom to power the board and connected peripherals even in this state.
The Linux kernel provides a framework for managing these transitions: cpufreq. The cpufreq subsystem allows the kernel to adjust the CPU’s clock speed and, consequently, its power consumption. This is managed through different governors:
By interacting with the cpufreq framework, users and system administrators can tune the power profile of the Raspberry Pi 5 to match the specific requirements of their application, whether that is maximum computational throughput or maximum battery life.
graph TD
    subgraph "CPU Governor Logic"
        Start[("CPU Load<br>Detected")] --> CheckGovernor{Current Governor?}

        CheckGovernor -- "performance" --> Perf[/"Set Freq = MAX<br><i>(e.g., 2.4 GHz)</i>"/]
        CheckGovernor -- "powersave" --> Power[/"Set Freq = MIN<br><i>(e.g., 1.5 GHz)</i>"/]
        CheckGovernor -- "ondemand" --> Ondemand{Load > Threshold?}
        CheckGovernor -- "schedutil" --> Sched{Scheduler Hint?}

        Ondemand -- "Yes" --> Ondemand_Max[/"Set Freq = MAX"/]
        Ondemand -- "No" --> Ondemand_Min[/Decrease Freq/]

        Sched -- "Need Perf" --> Sched_Max[/"Set Freq = Required"/]
        Sched -- "Idle" --> Sched_Min[/Decrease Freq/]

        Perf --> EndPerf(("⚡️<br>High Power<br>High Perf"))
        Power --> EndPower(("🔋<br>Low Power<br>Low Perf"))
        Ondemand_Max --> EndPerf
        Ondemand_Min --> EndPower
        Sched_Max --> EndBalanced(("⚖️<br>Balanced<br>Power/Perf"))
        Sched_Min --> EndPower
    end

    %% Styling
    style Start fill:#1e3a8a,stroke:#1e3a8a,stroke-width:2px,color:#ffffff
    style CheckGovernor fill:#f59e0b,stroke:#f59e0b,stroke-width:1px,color:#ffffff
    style Ondemand fill:#f59e0b,stroke:#f59e0b,stroke-width:1px,color:#ffffff
    style Sched fill:#f59e0b,stroke:#f59e0b,stroke-width:1px,color:#ffffff

    style Perf fill:#0d9488,stroke:#0d9488,stroke-width:1px,color:#ffffff
    style Power fill:#0d9488,stroke:#0d9488,stroke-width:1px,color:#ffffff
    style Ondemand_Max fill:#0d9488,stroke:#0d9488,stroke-width:1px,color:#ffffff
    style Ondemand_Min fill:#0d9488,stroke:#0d9488,stroke-width:1px,color:#ffffff
    style Sched_Max fill:#0d9488,stroke:#0d9488,stroke-width:1px,color:#ffffff
    style Sched_Min fill:#0d9488,stroke:#0d9488,stroke-width:1px,color:#ffffff

    style EndPerf fill:#ef4444,stroke:#ef4444,stroke-width:1px,color:#ffffff
    style EndPower fill:#10b981,stroke:#10b981,stroke-width:2px,color:#ffffff
    style EndBalanced fill:#8b5cf6,stroke:#8b5cf6,stroke-width:1px,color:#ffffff
Practical Examples
This section provides hands-on, step-by-step examples to measure, monitor, and manage your Raspberry Pi 5’s power consumption.
Warning: These examples involve connecting measurement hardware to your Raspberry Pi. Always ensure your connections are secure and that you are using a high-quality USB power meter and the official Raspberry Pi 27W USB-C Power Supply to avoid damaging your device.
Example 1: Measuring Power Consumption Under Different Loads
This example demonstrates the most direct way to understand your Pi’s power usage: measuring it with an external tool.
Hardware Requirements
- Raspberry Pi 5 with Raspberry Pi OS installed.
- Official Raspberry Pi 27W USB-C Power Supply.
- A USB-C Power Meter. These are inexpensive devices that sit inline between the power supply and the Pi. A popular choice is the MakerFocus or Klein Tools USB Power Meter.
- Monitor, keyboard, and mouse connected to the Pi.
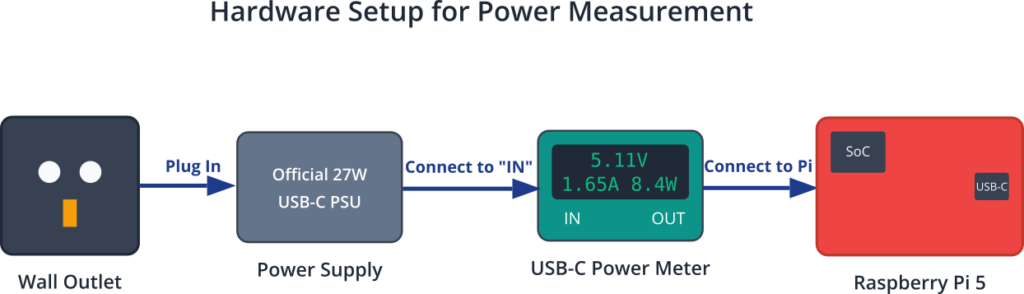
Hardware Integration
- Connect the official 27W power supply to the “IN” port of the USB-C power meter.
- Connect a high-quality USB-C cable from the “OUT” port of the power meter to the USB-C power port on your Raspberry Pi 5.
- Power on the system. The power meter should light up and display real-time voltage, current, and wattage.
Procedure and Code
We will measure power consumption in three distinct states: idle, CPU stress, and I/O stress.
Step 1: Measure Idle Power
Once your Raspberry Pi 5 has booted to the desktop, close all applications. Let the system sit idle for about two minutes to stabilize. Observe the reading on your USB power meter. Note the voltage (should be ~5.1V), current, and power (wattage). The idle power should be relatively stable.
Expected Output (on Power Meter):
- Voltage: ~5.1V
- Current: ~0.55A – 0.65A
- Power: ~2.8W – 3.3W
Step 2: Measure CPU Stress Power
Now, we will max out all four CPU cores to see the peak power consumption. We’ll use the stress-ng utility, which may need to be installed first.
Open a terminal and run the following commands:
# First, update your package list and install stress-ng
sudo apt update
sudo apt install stress-ng -y

# Now, run a stress test on all 4 CPU cores for 60 seconds
# The '--verbose' flag will show the progress.
echo "Starting CPU stress test..."
stress-ng --cpu 4 --timeout 60s --verbose
echo "CPU stress test complete."
While the test is running, closely watch the USB power meter. You will see the current and wattage jump significantly. Record the peak wattage displayed during the test.
Expected Output (on Power Meter):
- Power: ~8.0W – 9.5W (This can vary based on active cooling and silicon lottery).
Step 3: Measure I/O and Component Stress
A CPU-only test doesn’t represent the absolute maximum power draw. Activities like using the camera, writing to an NVMe SSD, and powering USB peripherals add to the total. A more comprehensive stress test can give a fuller picture.
# This command stresses CPU, memory, and I/O operations
echo "Starting comprehensive stress test..."
stress-ng --cpu 4 --io 4 --vm 2 --vm-bytes 1G --timeout 60s --verbose
echo "Comprehensive stress test complete."
Again, monitor the power meter for the peak reading. If you have a high-power USB device (like an external SSD) connected, you will see even higher consumption.
Expected Output (on Power Meter):
- Power: Potentially >10W, especially with active peripherals.
This practical measurement clearly demonstrates the dynamic power range of the Pi 5 and validates the need for a power supply that can handle these significant peaks without voltage droop.
Example 2: Monitoring Power State with Command-Line Tools
While an external meter shows the total power consumed, Linux provides tools to inspect the state of internal components, such as the CPU frequency.
Procedure and Code
We will use the /sys virtual filesystem to check the current CPU governor and frequency.
Step 1: Check the Current CPU Governor
The governor determines the policy for frequency scaling. To see which governor is active, use the cat command:
# The policy can be different for each core, but is usually the same.
# We check the policy for the first core (cpu0).
cat /sys/devices/system/cpu/cpu0/cpufreq/scaling_governor
Expected Output:
ondemand
Step 2: Monitor Real-time CPU Frequency
You can watch the CPU frequency change in real-time in response to load. The watch command is perfect for this.
# This command will show the current frequency of all 4 cores, updating every second.
# The frequency is reported in KHz.
watch -n 1 "cat /sys/devices/system/cpu/cpu*/cpufreq/scaling_cur_freq"
Open another terminal window while this is running. You will see the frequencies are low (e.g., 1500000 for 1.5 GHz). Now, in the second terminal, move your mouse around vigorously or open an application. You will see the frequencies in the first terminal immediately jump to their maximum (2400000 for 2.4 GHz).
This demonstrates the ondemand governor in action, directly linking system activity to the CPU’s power state.
Example 3: Basic Power Management by Changing the Governor
Let’s actively manage power by switching the CPU governor and observing the effect on both frequency and power consumption (using your USB meter).
Procedure and Code
We will use the cpufreq-utils package, which provides a convenient command to manage governors.
Step 1: Install cpufreq-utils
sudo apt update
sudo apt install cpufreq-utils -y
Step 2: Switch to performance Governor
This will lock the CPU at its maximum frequency.
# Set the governor to 'performance' for all cores
sudo cpufreq-set -g performance
Now, check the frequency again with the watch command from Example 2. You will see all cores are locked at 2400000 KHz, regardless of system load. Look at your USB power meter. You will notice the idle power consumption has increased compared to when the ondemand governor was active.
Step 3: Switch to powersave Governor
This will lock the CPU at its minimum frequency.
# Set the governor to 'powersave' for all cores
sudo cpufreq-set -g powersave
Check the frequency again. It will now be locked at the minimum, likely 1500000 KHz. Observe the USB power meter. The idle power consumption will be at its lowest. Try opening an application; you will notice the system feels much less responsive, as the CPU is not allowed to ramp up.
Step 4: Return to the Default ondemand Governor
It’s best to return to the default balanced governor for general use.
# Set the governor back to 'ondemand'
sudo cpufreq-set -g ondemand
This example provides a tangible link between a software configuration change and its direct impact on hardware performance and electrical power consumption.
Common Mistakes & Troubleshooting
Navigating power requirements can be tricky, and several common pitfalls can lead to frustrating instability or even damage. Here are some of the most frequent issues and how to resolve them.
Exercises
These exercises are designed to reinforce the concepts presented in this chapter and build your practical skills in power management.
- The Power Supply Audit:
- Objective: To develop a critical eye for power supply specifications.
- Task: Gather all the USB-C power adapters you can find in your home or lab. Examine the fine print on each one. Create a table listing the brand, model, and all the output profiles (voltage and current combinations) printed on the adapter.
- Verification: Identify which of these adapters, based on their printed specifications, are theoretically capable of powering the Raspberry Pi 5 correctly. Which ones are not? Note any that are explicitly USB-PD compliant. This exercise highlights how many chargers, despite having the right connector, are unsuitable.
- Charting a Power Profile:
- Objective: To visualize the power consumption of a real-world task over time.
- Task: Using the USB power meter setup from the practical examples, write a simple shell script that performs a specific, multi-stage task. For example, the script could first update the package lists (
sudo apt update), then compile a small C program, and finally, sit idle for 30 seconds. While the script runs, manually log the power reading from your meter every 5 seconds. - Verification: Plot the logged power data on a graph (using a spreadsheet or a tool like
gnuplot). Your graph should clearly show a baseline idle power, a spike during the network activity of the update, an even higher and sustained peak during compilation, and a return to idle. This visual profile provides a powerful illustration of dynamic power consumption.
- The Governor’s Impact on Performance:
- Objective: To quantify the trade-off between power saving and computational performance.
- Task: You will need to benchmark a task under two different CPU governors. First, find a simple C or Python program that performs a computationally intensive task (e.g., calculating a large number of Fibonacci numbers or a prime number sieve).
- Set the governor to
performance. Use thetimecommand to measure how long the program takes to execute (e.g.,time python3 my_script.py). Record the execution time and the peak power consumption from your USB meter. - Set the governor to
powersave. Run the exact same command again. Record the new, longer execution time and the lower peak power consumption.
- Set the governor to
- Verification: Compare your results. You will have concrete data showing that the
powersavegovernor used less power but took significantly longer to complete the task. This demonstrates the fundamental engineering trade-off that power management governors are designed to navigate.
Summary
- The Raspberry Pi 5 requires a 5V/5A (27W) USB-C Power Delivery (PD) compliant power supply to operate at its full potential.
- Using an underpowered or non-compliant supply can lead to system instability, peripheral failure, and data corruption.
- The DA9091 PMIC is a dedicated chip that manages all power distribution, monitoring, and protection on the board.
- The USB-C PD protocol enables an intelligent negotiation between the power supply and the Pi to agree upon a power profile.
- Power consumption is highly dynamic, varying significantly between idle, normal, and peak load states.
- The Linux kernel’s
cpufreqframework and its governors (ondemand,performance,powersave) provide a software layer to control CPU frequency and influence power usage. - Practical measurement using a USB power meter is the most effective way to understand real-world power draw.
- Troubleshooting power issues should always begin by verifying the power supply and the USB-C cable.
Further Reading
- Raspberry Pi 5 Product Brief: The official document from the Raspberry Pi Foundation, providing the most authoritative overview of the hardware specifications.
- USB Power Delivery Specification: The official technical specification from the USB Implementers Forum (USB-IF). While dense, it is the ultimate source of truth for the PD protocol.
- Available at:
https://www.usb.org/documents
- Available at:
- AN-CM-333 Renesas USB Power Delivery Application Note: A detailed application note from a major semiconductor manufacturer that explains the principles of USB-C and PD in a more accessible way than the full specification.
- Available via search on the Renesas website or general web search.
- Linux Kernel CPUFreq Documentation: The official kernel documentation explaining the CPU frequency scaling subsystem and its governors.
- “Measuring Raspberry Pi 5 Power Consumption” – Jeff Geerling: A practical and detailed blog post from a respected community member, showing real-world power measurements under various conditions.
- Available via web search for the title.
- Dialog Semiconductor (Renesas) DA9091 Datasheet: For a deep dive into the PMIC itself, the manufacturer’s datasheet provides detailed electrical characteristics and register maps.
- Available with a web search for “DA9091 datasheet”.
