
Chapter 18: Linux Commands: System Information (df, du, free, uname)
Chapter Objectives
By the end of this chapter, you will be able to:
- Understand the fundamental concepts of filesystem storage, memory usage, and system identification in an embedded Linux environment.
- Utilize the
dfandducommands to accurately analyze and report on disk space consumption at both the filesystem and directory levels. - Interpret the output of the
freecommand to distinguish between used, free, buffered, and cached memory. - Employ the
unamecommand to retrieve critical system hardware and kernel information for diagnostics and scripting. - Implement simple shell scripts to automate system monitoring tasks on a Raspberry Pi 5.
- Diagnose and troubleshoot common issues related to resource management in constrained embedded systems.
Introduction
In the world of embedded systems, resources are not infinite. Unlike a desktop computer with terabytes of storage and vast amounts of RAM, an embedded device like the Raspberry Pi 5 operates within strict constraints. A filesystem that unexpectedly fills up can cause a critical field-deployed application to fail. A memory leak, however small, can eventually exhaust available RAM, leading to system instability or a complete crash. Understanding and monitoring these fundamental resources—storage and memory—is not merely an administrative task; it is a core competency for any embedded systems engineer.
This chapter introduces you to the essential command-line utilities that provide a window into the health of your embedded Linux system. We will explore the tools that answer fundamental questions: How much disk space is left? What is consuming all the storage? Is the system running out of memory? What specific version of the kernel is running on this hardware? These are not abstract queries; they are the first steps in debugging, optimization, and ensuring long-term reliability. The commands df, du, free, and uname are your first line of defense, providing the raw data needed to make informed decisions about your application’s design and performance. As we move from simple command execution to practical scripting, you will learn to transform this data into actionable insights, a skill that is indispensable for developing robust and efficient embedded products.
Technical Background
At the heart of any computing system lies the management of its finite resources, primarily storage and memory. In an embedded Linux system, where these resources are often tightly constrained, a deep understanding of how they are allocated, used, and reported is paramount. The tools we explore in this chapter are not simple utilities; they are interfaces to the kernel’s complex subsystems that manage the very foundation upon which our applications run.
The Filesystem and Disk Space: A Tale of Two Perspectives
To a user, a filesystem appears as a hierarchical structure of directories and files. To the operating system, however, it is a highly organized data structure laid out on a block storage device, such as an SD card or an eMMC module. The Linux kernel uses a virtual filesystem (VFS) layer, which provides a unified interface to various types of filesystems (like ext4, FAT32, or Btrfs). This abstraction allows user-space applications to interact with files and directories using the same system calls, regardless of the underlying filesystem format.
When a filesystem is created on a partition, the process allocates a specific number of inodes and data blocks. An inode (index node) is a data structure that stores metadata about a file—its permissions, owner, timestamps, and, most importantly, pointers to the actual data blocks where the file’s content is stored. The data blocks are fixed-size chunks of the storage medium that hold the content itself. This separation of metadata (inodes) and content (data blocks) is a cornerstone of Unix-like filesystems.
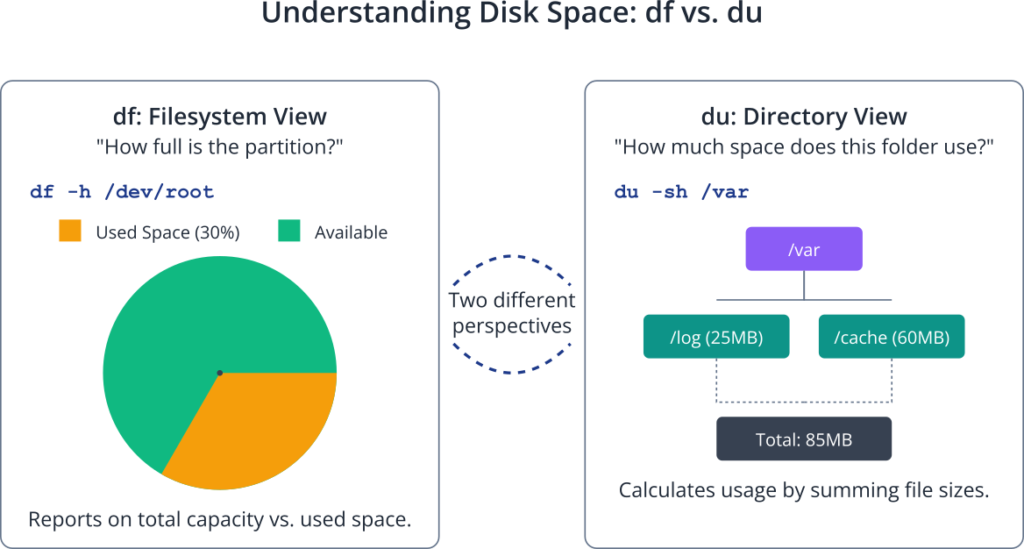
This architectural distinction leads to two different ways of looking at disk usage. The first perspective is that of the filesystem as a whole: how much of the total allocated space on a partition is currently in use? This is the question answered by the df (disk free) command. It queries the filesystem’s superblock, a special block containing high-level information about the filesystem, to get statistics on the total number of blocks, the number of free blocks, and the number of available blocks. It provides a high-level, “30,000-foot view” of one or more mounted storage volumes.
The second perspective is that of the files and directories themselves: how much space is being consumed by a specific directory tree? This is the question answered by the du (disk usage) command. Unlike df, which gets its information from the filesystem’s pre-calculated summary, du performs a more laborious task. It recursively walks through a directory hierarchy, examining each file it encounters. For each file, it checks the inode to determine how many data blocks the file occupies and sums up these values to report the total. This bottom-up approach provides a granular view of where storage is being used, making it an indispensable tool for hunting down space-hogging log files or temporary data. The fundamental difference is that df reports on the capacity of a mounted volume, while du calculates the sum of the sizes of specified files and directories.
The Complex World of Linux Memory Management
Memory management in Linux is far more sophisticated than a simple division into “used” and “free” categories. To optimize performance, the kernel aggressively uses any available RAM to speed up disk operations. This is where the concepts of buffers and cache become critical.
When an application writes data to a file, the kernel doesn’t necessarily write it to the physical storage device immediately. Writing to an SD card is orders of magnitude slower than writing to RAM. To keep the application responsive, the kernel first copies the data into a temporary storage area in RAM known as the buffer cache. The application can then continue its work, believing the write is complete. In the background, the kernel manages the process of “flushing” these “dirty” buffers to the disk at an opportune moment. This mechanism is called a write-back cache.
Similarly, when data is read from the disk, the kernel stores a copy in RAM in what is called the page cache. If the same data is requested again, the kernel can serve it directly from the fast main memory, avoiding a slow disk read. This is why subsequent reads of the same file are often much faster than the first.
%%{init: {'theme': 'base', 'themeVariables': { 'fontFamily': 'Open Sans'}}}%%
graph TD
    subgraph Process Pipeline
        A[Start: Identify Target Directory<br>e.g., /usr/lib]
        B{Run du Command<br>sudo du -h /usr/lib}
        C{"Pipe | to sort<br>sort -rh"}
        D{"Pipe | to head<br>head -n 5"}
        E[End: Display Top 5<br>Largest Directories]
    end

    %% Styling
    style A fill:#1e3a8a,stroke:#1e3a8a,stroke-width:2px,color:#ffffff
    style B fill:#0d9488,stroke:#0d9488,stroke-width:1px,color:#ffffff
    style C fill:#0d9488,stroke:#0d9488,stroke-width:1px,color:#ffffff
    style D fill:#0d9488,stroke:#0d9488,stroke-width:1px,color:#ffffff
    style E fill:#10b981,stroke:#10b981,stroke-width:2px,color:#ffffff

    %% Connections
    A --> B --> C --> D --> E
The free command provides a snapshot of this dynamic environment. The output can be initially confusing because the used memory column includes the memory allocated to buffers and the page cache. A novice might see a large used value and a small free value and incorrectly conclude the system is out of memory. However, the crucial insight is that the kernel can instantly reclaim the memory used for buffers and cache if an application needs it for its own purposes. This memory is therefore considered available. The free command presents this nuanced view, typically showing a line for the raw used/free numbers and another, more meaningful line showing how much is truly available for new applications. Understanding this distinction is vital for correctly diagnosing memory pressure in an embedded system.

System Identity: Kernel and Hardware Architecture
In embedded development, you often work with multiple devices, different hardware revisions, or various software builds. A script that works on one device might fail on another if the underlying hardware or kernel differs. It is essential to have a reliable way to programmatically identify the system you are working on.
The uname (Unix name) command is the standard tool for this purpose. It queries the kernel for fundamental pieces of information about itself and the machine it is running on. This includes:
- Kernel Name: The name of the kernel (e.g., “Linux”).
- Node Name: The network hostname of the machine.
- Kernel Release: The specific version of the kernel (e.g.,
6.6.20-v8-16k+). This is crucial for checking compatibility with kernel modules or certain features. - Kernel Version: A more detailed string that often includes the build date and compiler information.
- Machine Hardware Name: The processor architecture (e.g.,
aarch64for the 64-bit ARM architecture of the Raspberry Pi 5). This is fundamental for ensuring you are using the correct cross-compiler and binaries. - Operating System: The name of the operating system (e.g., “GNU/Linux”).
By combining the various options of uname, a developer can create a unique fingerprint of a system’s software and hardware foundation. This is invaluable for automated testing, deployment scripts that need to adapt to different targets, and for debugging reports where precise environment details are required. For instance, a bug might only manifest on a specific kernel release or hardware architecture. uname provides the definitive data to confirm these details without ambiguity.
Practical Examples
Theory provides the foundation, but proficiency is built through hands-on practice. In this section, we will use the Raspberry Pi 5 to explore the practical applications of these system information commands. We will move from simple execution to combining them in scripts for effective monitoring.
Build and Configuration Steps
For these examples, you will need a Raspberry Pi 5 running the standard Raspberry Pi OS (based on Debian). No special build or configuration is required, as these utilities are part of the GNU Core Utilities (coreutils) package, which is a fundamental component of every Linux distribution.
Hardware Setup:
- Raspberry Pi 5
- microSD card (16GB or larger) with Raspberry Pi OS installed
- Power supply
- Keyboard, mouse, and monitor, or an SSH connection from another computer.
Tip: For headless operation (without a monitor), connect your Raspberry Pi to your local network and use SSH. You can find its IP address from your router’s administration page or by using a network scanning tool.
Analyzing Filesystem Usage with df
The df command gives you a high-level overview of your mounted filesystems.
1. Basic Usage:
Open a terminal on your Raspberry Pi and run the command without any options.
dfThe output will look something like this, with numbers representing 1K blocks, which is not very easy to read.
Filesystem     1K-blocks    Used Available Use% Mounted on
udev             2029424       0   2029424   0% /dev
tmpfs             414320   11616    402704   3% /run
/dev/mmcblk0p2  58887104 5334268  50541076  10% /
tmpfs            2071520     816   2070704   1% /dev/shm
tmpfs               5120      48      5072   1% /run/lock
/dev/mmcblk0p1    522230   69874    452356  14% /boot/firmware
tmpfs             414304     176    414128   1% /run/user/1000
2. Human-Readable Output:
To make the output more intuitive, use the -h (human-readable) flag. This will display sizes in powers of 1024 (K, M, G).
df -hExpected Output:
Filesystem      Size  Used Avail Use% Mounted on
udev            2.0G     0  2.0G   0% /dev
tmpfs           405M   12M  394M   3% /run
/dev/mmcblk0p2   57G  5.1G   49G  10% /
tmpfs           2.0G  816K  2.0G   1% /dev/shm
tmpfs           5.0M   48K  5.0M   1% /run/lock
/dev/mmcblk0p1  510M   69M  442M  14% /boot/firmware
tmpfs           405M  176K  405M   1% /run/user/1000
Explanation:
- /dev/root: This is your main filesystem on the SD card. In this example, it’s 15GB in size, with 4.1GB used, leaving 9.9GB available. The usage is 30%.
- tmpfs: These are temporary filesystems that live entirely in RAM. They are used for things like
/dev/shm(shared memory) and/run(runtime variable data). Their contents are lost on reboot. This is a common technique in embedded systems to reduce writes to flash storage and speed up access to temporary files. - /boot/firmware: This is the boot partition, containing the kernel, firmware, and configuration files needed to start the Raspberry Pi.
3. Checking a Specific Filesystem:
You can also ask df to report on a specific directory or device.
df -h /home/piThis will show the usage for the filesystem that contains the /home/pi directory.
Pinpointing Space Hogs with du
While df tells you how full a disk is, du tells you what is filling it up.
1. Basic Usage:
Navigate to a directory, for example, your home directory, and run du.
cd /home/pi
du
This is often overwhelming, as it lists the size of every single subdirectory.
2. Summarized, Human-Readable Output:
The most common way to use du is with the -s (summarize) and -h (human-readable) flags. This calculates the total for the current directory.
du -sh /var/logExpected Output:
25M /var/logThis tells you that the entire /var/log directory and its contents occupy 25 megabytes of disk space.
3. Finding the Largest Directories:
A powerful technique for finding where space is being used is to combine du with the sort and head commands. Let’s find the top 5 largest directories within /usr/lib.
sudo du -h /usr/lib | sort -rh | head -n 5Expected Output:
1.2G	/usr/lib
550M	/usr/lib/x86_64-linux-gnu
230M	/usr/lib/libreoffice
150M	/usr/lib/gcc
95M	/usr/lib/python3
Code Snippet Explanation:
sudo du -h /usr/lib: We usesudobecause some directories inside/usr/libmay not be readable by a regular user. The command calculates the disk usage for all subdirectories.|: This is the pipe operator. It sends the output of theducommand to the input of thesortcommand.sort -rh: This sorts the incoming lines. The-rflag reverses the sort order (largest first), and the-hflag enables human-numeric sort, so it correctly understands that ‘1.2G’ is larger than ‘550M’.head -n 5: This takes the sorted list and shows only the first 5 lines, which represent the 5 largest items.
Interpreting Memory Usage with free
The free command is your window into the system’s RAM.
1. Human-Readable Output:
Always use the -h flag for an understandable view.
free -hExpected Output:
              total        used        free      shared  buff/cache   available
Mem:          3.8Gi       550Mi       2.8Gi        10Mi       515Mi       3.1Gi
Swap:         100Mi          0B       100Mi
Explanation of Mem line:
Scripting a Simple System Monitor
Let’s combine these commands into a simple shell script that logs the system status to a file.
%%{init: {'theme': 'base', 'themeVariables': { 'fontFamily': 'Open Sans'}}}%%
graph TD
    A[Start Script] --> B(Define LOG_FILE path);
    B --> C(Generate TIMESTAMP);
    C --> D["Append Header with TIMESTAMP to LOG_FILE"];
    D --> E{Run uname -a};
    E --> F["Append System Info to LOG_FILE"];
    F --> G{Run df -h /};
    G --> H["Append Filesystem Usage to LOG_FILE"];
    H --> I{Run free -h};
    I --> J["Append Memory Usage to LOG_FILE"];
    J --> K["Append Footer to LOG_FILE"];
    K --> L[End Script];

    %% Styling
    style A fill:#1e3a8a,stroke:#1e3a8a,stroke-width:2px,color:#ffffff
    style L fill:#10b981,stroke:#10b981,stroke-width:2px,color:#ffffff
    style B fill:#8b5cf6,stroke:#8b5cf6,stroke-width:1px,color:#ffffff
    style C fill:#8b5cf6,stroke:#8b5cf6,stroke-width:1px,color:#ffffff
    style E fill:#0d9488,stroke:#0d9488,stroke-width:1px,color:#ffffff
    style G fill:#0d9488,stroke:#0d9488,stroke-width:1px,color:#ffffff
    style I fill:#0d9488,stroke:#0d9488,stroke-width:1px,color:#ffffff
    style D fill:#ef4444,stroke:#ef4444,stroke-width:1px,color:#ffffff
    style F fill:#ef4444,stroke:#ef4444,stroke-width:1px,color:#ffffff
    style H fill:#ef4444,stroke:#ef4444,stroke-width:1px,color:#ffffff
    style J fill:#ef4444,stroke:#ef4444,stroke-width:1px,color:#ffffff
    style K fill:#ef4444,stroke:#ef4444,stroke-width:1px,color:#ffffff
File Structure:
Create a directory for our script.
mkdir ~/system-monitor
cd ~/system-monitor
Create a file named monitor.sh.
Code Snippet (monitor.sh):
#!/bin/bash

# A simple script to log system resource usage.

LOG_FILE="/home/pi/system-monitor/system_stats.log"
TIMESTAMP=$(date +"%Y-%m-%d %T")

echo "--- System Status Log: $TIMESTAMP ---" >> $LOG_FILE

# 1. System Identity
echo "--- System Info ---" >> $LOG_FILE
uname -a >> $LOG_FILE
echo "" >> $LOG_FILE

# 2. Filesystem Usage (Root Partition)
echo "--- Filesystem Usage (/dev/root) ---" >> $LOG_FILE
df -h / >> $LOG_FILE
echo "" >> $LOG_FILE

# 3. Memory Usage
echo "--- Memory Usage ---" >> $LOG_FILE
free -h >> $LOG_FILE
echo "" >> $LOG_FILE

echo "--- Log Complete ---" >> $LOG_FILE
echo "" >> $LOG_FILE
Build and Run Steps:
- Make the script executable:
chmod +x monitor.sh - Run the script:
./monitor.sh - Check the output:
cat system_stats.log
Expected Output (system_stats.log):
--- System Status Log: 2023-10-27 14:30:01 ---
--- System Info ---
Linux raspberrypi 6.1.0-rpi7-rpi-v8 #1 SMP PREEMPT Debian 1:6.1.54-1+rpi1 (2023-10-05) aarch64 GNU/Linux

--- Filesystem Usage (/dev/root) ---
Filesystem      Size  Used Avail Use% Mounted on
/dev/root        15G  4.1G  9.9G  30% /

--- Memory Usage ---
              total        used        free      shared  buff/cache   available
Mem:          3.8Gi       550Mi       2.8Gi        10Mi       515Mi       3.1Gi
Swap:         100Mi          0B       100Mi

--- Log Complete ---
This simple script can be scheduled to run periodically using a cron job, providing a historical record of your device’s resource usage, which is invaluable for diagnosing slow-leaking bugs or performance degradation over time.
Common Mistakes & Troubleshooting
When first using these commands, developers often fall into a few common traps. Understanding these pitfalls can save hours of confusion and misdiagnosis.
Exercises
These exercises are designed to reinforce your understanding and encourage you to explore the commands on your own Raspberry Pi 5.
- The Log File Detective:
- Objective: Find the largest log file in the
/var/logdirectory. - Steps:
- Navigate to the
/var/logdirectory. - Use a combination of
duand other command-line tools to list all the files (not directories) in this location and sort them by size. - Identify the single largest file.
- Navigate to the
- Hint:
duby default works on directories. Look at its man page (man du) to see how to make it work on files. The-aflag might be useful. - Verification: Your output should be a sorted list of files, with the largest at the top or bottom, depending on your
sortoptions.
- Objective: Find the largest log file in the
- Memory Usage Report:
- Objective: Write a shell script that reports the total, available, and cached memory in megabytes, with clear labels.
- Steps:
- Create a new shell script file.
- Use the
free -mcommand (which reports in megabytes). - Use tools like
awkorgrepandcutto extract only the numbers you need from theMem:line. - Use
echoto print the values with descriptive text, like “Available Memory: 3100 MB”.
- Verification: Running your script should produce a clean, three-line report showing only the requested memory values.
- Architecture-Specific Script:
- Objective: Write a script that prints one message if it’s running on a 64-bit ARM system (
aarch64) and a different message if it’s running on any other architecture. - Steps:
- Use the
uname -mcommand to get the machine hardware name. - Use a shell
if-then-elsestatement to compare the output of the command to the string “aarch64”. echoa success message in theifblock and a “different architecture” message in theelseblock.
- Use the
- Verification: On your Raspberry Pi 5, the script should print the
aarch64message.
- Objective: Write a script that prints one message if it’s running on a 64-bit ARM system (
- Disk Fullness Alert:
- Objective: Create a script that checks the root filesystem’s usage percentage and prints a warning if it exceeds a certain threshold (e.g., 80%).
- Steps:
- Use
df /to get the data for the root filesystem. - Use
grep,awk, or other text processing tools to isolate the usage percentage number. You will need to remove the ‘%’ sign. - Use a shell
ifstatement with the-gt(greater than) operator to compare the usage to your threshold. echoa “WARNING: Disk space is critically low!” message if the condition is met.
- Use
- Verification: Test your script by changing the threshold value. Set it to a low number (e.g., 10%) to confirm the warning message appears correctly.
Summary
- Resource monitoring is critical in embedded systems due to constrained hardware.
df(disk free) provides a high-level summary of filesystem usage per partition. Usedf -hfor human-readable output.du(disk usage) calculates the space consumed by specific files and directories, making it ideal for finding what is using up space. Usedu -shfor a summarized total.- Linux memory management is complex, using free RAM for buffers and caching to improve performance.
freeis the tool to inspect memory. Theavailablefield is the most important metric, as it represents the memory that can be reclaimed for applications.unameprovides essential system identification information, such as kernel release (-r) and hardware architecture (-m), which is vital for scripting and diagnostics.- Combining these commands with pipes (
|) and tools likesort,grep, andawkenables powerful, automated system monitoring.
Further Reading
- GNU Coreutils Manual: The official documentation for
df,du,free, anduname. This is the authoritative source for all command-line options. - The Linux Kernel Documentation – Memory Management: For a very deep dive into how the kernel handles memory.
- Linux Journey: An excellent, interactive site for learning Linux concepts from the ground up.
- Raspberry Pi Documentation: Official hardware and software documentation for the Raspberry Pi platform.
- “How Linux Works: What Every Superuser Should Know” by Brian Ward: A highly-regarded book that explains the internals of a Linux system in a clear and accessible way.
- Brendan Gregg’s Blog: An industry expert on Linux performance analysis and tools. His articles provide incredible depth on system observability.
