
Chapter 85: Leaks, Dangling Pointers, Double Free, and Buffer Overflows
Chapter Objectives
By the end of this chapter, you will be able to:
- Understand the fundamental causes and system-level consequences of common memory errors, including memory leaks, dangling pointers, double-free vulnerabilities, and buffer overflows.
- Implement defensive programming techniques in C to proactively prevent memory-related bugs in embedded applications.
- Utilize standard Linux debugging tools, such as Valgrind and the GNU Debugger (GDB), to detect, diagnose, and pinpoint memory errors in running programs on a Raspberry Pi 5.
- Analyze the output from memory analysis tools to identify the root cause of a memory fault and apply the correct fix.
- Configure a development environment with AddressSanitizer (ASan) to perform runtime memory error detection during the development and testing phases.
- Debug buffer overflow vulnerabilities and understand how they can be exploited to compromise system security.
Introduction
In the world of embedded Linux systems, where resources are often constrained and reliability is paramount, memory management is not merely a programming task—it is a critical engineering discipline. Unlike desktop systems with gigabytes of RAM and virtual memory swap files, an embedded device, such as a sensor node in an industrial control system or a controller in a consumer appliance, must operate flawlessly for extended periods, often unattended. In this environment, a seemingly minor memory bug can have catastrophic consequences. A slow memory leak in a long-running daemon can eventually exhaust all available memory, causing the system to crash. A dangling pointer can lead to unpredictable behavior, corrupting data or causing sporadic, hard-to-diagnose faults. A buffer overflow, the most notorious of memory errors, can open a door for malicious attackers to execute arbitrary code and take complete control of a device.
This chapter delves into the four most common and dangerous types of memory errors that plague C and C++ developers: memory leaks, dangling pointers, double-free errors, and buffer overflows. These issues arise primarily because C provides direct, low-level access to memory, a feature that gives it unparalleled performance and control but also places the full responsibility for memory safety squarely on the developer’s shoulders. We will move beyond the theoretical to explore the practical impact of these errors on a real-world embedded platform, the Raspberry Pi 5. You will learn not just what these errors are, but why they happen and how they manifest in a resource-constrained Linux environment. We will equip you with the essential tools and techniques to become a memory-safe developer, using powerful utilities like Valgrind and AddressSanitizer to hunt down and eliminate these elusive but critical bugs before they can compromise your system’s stability and security. By mastering these concepts, you will take a significant step towards writing robust, reliable, and secure embedded software.
Technical Background
At the heart of every C program lies a fundamental contract between the developer and the operating system regarding memory. The OS provides a virtual address space for the process, a private sandbox divided into distinct regions. The most relevant for our discussion are the stack, the heap, and the data/BSS segments. The stack is a highly organized, last-in-first-out (LIFO) region used for static memory allocation, managing function calls, local variables, and return addresses. Its size is typically fixed at the start of the program, and memory is managed automatically by the compiler. When a function is called, a “stack frame” is pushed onto the stack; when it returns, the frame is popped off. This process is fast, efficient, and deterministic.
The heap, in contrast, is the region for dynamic memory allocation. It is a large, less-structured pool of memory available for the program to use at runtime. When a program needs a block of memory whose size is not known at compile time or whose lifetime must extend beyond the scope of the function that creates it, it requests it from the heap using functions like malloc(), calloc(), or realloc(). This allocation is managed by a heap manager, a component of the C standard library (like glibc on most Linux systems), which finds a suitable free block and returns a pointer to it. The critical part of this contract is that the developer is responsible for explicitly returning this memory to the system using free() when it is no longer needed. It is the breakdown of this manual management process that gives rise to the most pernicious memory errors.

The Insidious Nature of Memory Leaks
A memory leak occurs when a program allocates memory from the heap but fails to release it back to the system after it has finished using it. The pointer to the allocated memory block is lost, meaning the program no longer has a reference to it, but the memory itself remains marked as “in use.” From the perspective of the heap manager, this block is still owned by the application and cannot be reallocated for other purposes. It becomes an orphaned block of memory, consuming a finite resource for no reason.
In a short-running desktop application, a small memory leak might go unnoticed. The program terminates, and the operating system reclaims its entire memory space, cleaning up the mess. However, in an embedded system designed for continuous operation—a “24/7/365” device—the effect of a memory leak is cumulative and devastating. Imagine a network daemon that leaks a few kilobytes of memory every time it handles a request. Over hours, days, or weeks, these small, repeated leaks accumulate, slowly consuming the available RAM. This gradual exhaustion of memory is often called a “slow death.” System performance degrades as the Linux kernel’s Out-Of-Memory (OOM) killer is forced to intervene, terminating processes to free up memory. Eventually, the leaking process itself or a critical system service may be killed, leading to a device failure.
The root cause of a memory leak is often a simple logical oversight. A common scenario involves allocating memory within a function but failing to free it on all possible exit paths. For instance, a function might allocate a buffer, but if an error condition occurs midway through its execution, it might return early without reaching the free() call at the end. Another classic cause is overwriting a pointer variable that holds the only reference to a dynamically allocated block.
void process_data() {
    char *buffer = (char *) malloc(1024); // Allocate 1KB
    // ... some processing ...
    if (is_error_condition()) {
        // Error occurred, we exit the function early
        return; // BUG: buffer is not freed!
    }
    // ... more processing ...
    strcpy(buffer, "new data");

    // Another allocation overwrites the original pointer
    buffer = (char *) malloc(2048); // The original 1024-byte block is now leaked

    free(buffer); // This only frees the 2048-byte block
}
In this example, two separate leaks can occur. The early return leaks the initial 1024-byte block. Later, reassigning buffer to a new malloc call without first freeing the old block also orphans the original memory. The heap manager sees these blocks as allocated, but the program has lost the addresses needed to free them.
graph TD
    subgraph "Program Execution"
        A[Start: Request Memory] --> B{Need dynamic memory?};
        B -- Yes --> C["char* ptr = malloc(size)"];
        B -- No --> E[End];
        C --> D{Use memory via ptr};
        D --> F{Is ptr still needed?};
        F -- Yes --> D;
        F -- No --> G{"Did you free(ptr)?"};
        G -- No --> H((<b>Memory Leak!</b><br><i>Orphaned Block</i>));
        G -- Yes --> I[Memory Returned to Heap];
        I --> E;
    end

    subgraph "Heap State"
        J(Available Memory Pool) --> K(Allocated Block);
        K --> J;
        H -.-> L(<b>Lost Block</b><br><i>Cannot be freed or reused</i>);
    end

    classDef primary fill:#1e3a8a,stroke:#1e3a8a,stroke-width:2px,color:#ffffff;
    classDef endo fill:#10b981,stroke:#10b981,stroke-width:2px,color:#ffffff;
    classDef decision fill:#f59e0b,stroke:#f59e0b,stroke-width:1px,color:#ffffff;
    classDef process fill:#0d9488,stroke:#0d9488,stroke-width:1px,color:#ffffff;
    classDef error fill:#ef4444,stroke:#ef4444,stroke-width:1px,color:#ffffff;
    classDef system fill:#8b5cf6,stroke:#8b5cf6,stroke-width:1px,color:#ffffff;

    class A,E primary;
    class B,F,G decision;
    class C,D,I process;
    class H,L error;
    class J,K system;
This process leads to heap fragmentation. Over time, the heap becomes littered with these small, unusable orphaned blocks, making it difficult for the allocator to find contiguous chunks of memory for larger requests, even if the total amount of free memory is sufficient.
Dangling Pointers and the Specter of Undefined Behavior
If a memory leak is a crime of negligence, a dangling pointer is a crime of reckless endangerment. A dangling pointer is a pointer that continues to reference a memory location that has already been deallocated or freed. The memory block it points to is no longer owned by the program; the heap manager has returned it to the pool of available memory and may have already reallocated it to another part of the program for a completely different purpose. Using a dangling pointer to read or write memory is a severe error that leads to undefined behavior.
Undefined behavior is one of the most dreaded concepts in C programming. It means the C standard places no requirements on what the program must do. It might crash immediately with a segmentation fault, it might corrupt seemingly unrelated data, or, most insidiously, it might appear to work correctly, only to fail later in a completely different part of the code. This non-deterministic nature makes bugs caused by dangling pointers incredibly difficult to reproduce and debug.
A common way to create a dangling pointer is to free a block of memory and then attempt to use the pointer again without setting it to NULL.
void create_dangling_pointer() {
    int *ptr = (int *) malloc(sizeof(int));
    *ptr = 42;

    printf("Value before free: %d\n", *ptr);

    free(ptr); // ptr is now a dangling pointer

    // ... some time passes, other allocations may happen ...

    printf("Value after free: %d\n", *ptr); // UNDEFINED BEHAVIOR
    *ptr = 100; // UNDEFINED BEHAVIOR: Writing to freed memory
}
After free(ptr) is called, the memory location that ptr points to is returned to the heap. The ptr variable itself still holds the same address, but that address is no longer valid. When we later dereference ptr to read its value, we might read garbage data, or we might read the value left over from the previous allocation. If we write to it, we are corrupting a piece of memory that may now belong to another data structure in our program, leading to silent data corruption that is almost impossible to trace back to its source.
sequenceDiagram
    actor Developer
    participant Program
    participant HeapManager

    Developer->>Program: 1. `ptr = malloc(sizeof(int))`
    activate Program
    Program->>HeapManager: Request memory block
    activate HeapManager
    HeapManager-->>Program: Return address `0xADDR`
    deactivate HeapManager
    Program-->>Developer: `ptr` now holds `0xADDR`
    Developer->>Program: 2. `*ptr = 42` (Write to valid memory)
    Developer->>Program: 3. `free(ptr)`
    Program->>HeapManager: Deallocate memory at `0xADDR`
    activate HeapManager
    HeapManager-->>Program: Memory `0xADDR` is now free
    deactivate HeapManager
    Program-->>Developer: `ptr` is now a dangling pointer
    deactivate Program

    Note right of Developer: Time passes... HeapManager may<br>reallocate `0xADDR` for another purpose.

    Developer-xProgram: 4. `*ptr = 100` (Use-After-Free)
    activate Program
    Note over Program: UNDEFINED BEHAVIOR!<br>Writing to freed memory.<br>May corrupt other data or crash.
    Program--xDeveloper: Crash or silent corruption
    deactivate Program
Another frequent cause of dangling pointers is returning a pointer to a local variable from a function. Local variables reside on the stack. When the function returns, its stack frame is destroyed, and the memory occupied by its local variables is reclaimed. A pointer to that memory is now dangling.
int* get_local_variable_address() {
    int local_val = 123;
    return &local_val; // BUG: Returning address of a stack variable
}

void caller_function() {
    int *dangling_ptr = get_local_variable_address();
    // The stack space for local_val is now gone.
    // It has likely been overwritten by the stack frame of printf.
    printf("Value from dangling pointer: %d\n", *dangling_ptr); // UNDEFINED BEHAVIOR
}
The moment get_local_variable_address returns, local_val ceases to exist. The pointer dangling_ptr points to a dead region of the stack, which will be immediately reused by the next function call (printf in this case). Accessing *dangling_ptr will read whatever garbage happens to be at that memory location.
Tip: A best practice to mitigate dangling pointers is to set a pointer to
NULLimmediately after freeing it. This doesn’t solve the underlying logical error of using the pointer after it’s freed, but it ensures that any subsequent attempt to dereference it will cause an immediate, deterministic crash (a segmentation fault on most systems) rather than silent data corruption.free(ptr); ptr = NULL;
The Double-Free Vulnerability
A double-free error is a specific and particularly dangerous type of dangling pointer issue. It occurs when a program calls free() more than once on the same memory address. This action corrupts the internal data structures that the heap manager uses to keep track of free and allocated blocks. The heap manager’s metadata, which often resides in headers just before or after the allocated blocks themselves, can be overwritten, leading to a crash or, in more severe cases, an exploitable security vulnerability.
The internal workings of a heap allocator like glibc‘s ptmalloc are complex. It maintains linked lists of free memory chunks, called “bins,” organized by size. When free() is called on a block, the allocator manipulates these lists to add the block back into the appropriate bin. If free() is called a second time on the same pointer, the allocator’s logic is tricked into operating on a block it believes is already free. This can cause the linked list pointers to be corrupted in such a way that the allocator might write arbitrary data to an arbitrary location during subsequent malloc() calls. This is the basis of several advanced heap exploitation techniques, where an attacker can gain control of the program’s execution flow.
A simple double-free error looks like this:
void cause_double_free() {
    char *buf = (char *) malloc(128);
    strcpy(buf, "some data");

    free(buf); // First free, correct.

    // ... some other code executes ...

    // An accidental second free on the same pointer
    free(buf); // BUG: Double-free. Heap corruption is likely.
}
This bug often arises in complex code where two different parts of the program hold a copy of the same pointer and both believe they are responsible for freeing it. For example, a data structure might be passed to a cleanup function that frees its members, but the original calling function might also attempt to free it later, unaware that it has already been deallocated. Like the general dangling pointer problem, setting the pointer to NULL after the first free can help prevent this. A call to free(NULL) is guaranteed to be safe and do nothing.
graph TD
    A["Start: ptr = malloc(size)"] --> B["Program uses memory at ptr"];
    B --> C["First free(ptr)"];
    C --> D{Is ptr set to NULL?};

    subgraph "Correct Path"
        D -- Yes --> E["ptr = NULL"];
        E --> F["Second free(ptr) is safe<br><i>(free(NULL) does nothing)</i>"];
        F --> G((Success: No Error));
    end

    subgraph "Vulnerable Path"
        D -- No --> H["ptr still holds old address<br><i>(It's a dangling pointer)</i>"];
        H --> I["Second free(ptr) called"];
        I --> J((<b>Double-Free Error!</b><br><i>Heap metadata corrupted</i>));
        J --> K{"May lead to crash or<br>security exploitation"};
    end

    classDef primary fill:#1e3a8a,stroke:#1e3a8a,stroke-width:2px,color:#ffffff;
    classDef endo fill:#10b981,stroke:#10b981,stroke-width:2px,color:#ffffff;
    classDef decision fill:#f59e0b,stroke:#f59e0b,stroke-width:1px,color:#ffffff;
    classDef process fill:#0d9488,stroke:#0d9488,stroke-width:1px,color:#ffffff;
    classDef error fill:#ef4444,stroke:#ef4444,stroke-width:1px,color:#ffffff;
    classDef warning fill:#eab308,stroke:#eab308,stroke-width:1px,color:#1f2937;

    class A primary;
    class G endo;
    class D decision;
    class B,C,E,F,H,I process;
    class J error;
    class K warning;
Buffer Overflows: The Gateway to Exploitation
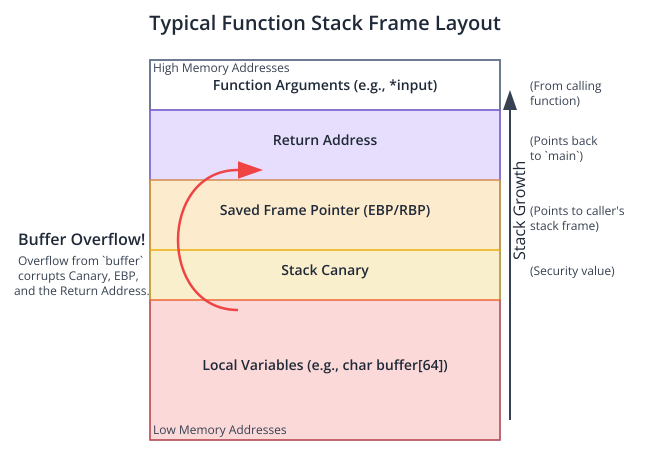
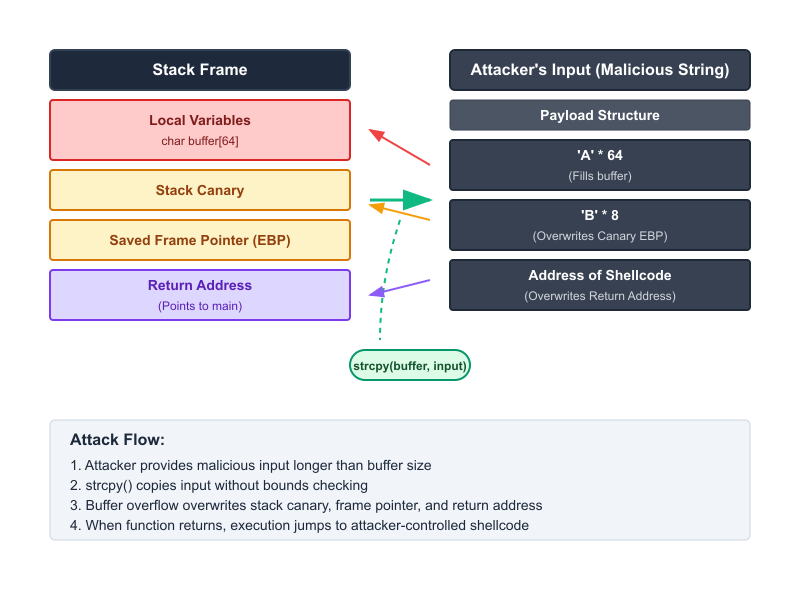
A buffer overflow is arguably the most infamous memory error. It occurs when a program attempts to write data beyond the allocated boundary of a buffer. This overwrites adjacent memory regions, which can contain other variables, control data, or function return addresses. The consequences range from simple program crashes to complete system compromise. Buffer overflows can happen on both the stack and the heap, but stack-based overflows are historically the most exploited.
A stack-based buffer overflow occurs when a fixed-size buffer declared as a local variable within a function is overwritten. The stack frame for a function contains not only its local variables but also the saved frame pointer and, most critically, the return address. The return address is the location in the code where execution should resume after the current function completes.
Consider a function that uses a fixed-size buffer to store user input:
#include <stdio.h>
#include <string.h>

void vulnerable_function(const char *input) {
    char buffer[64]; // 64-byte buffer on the stack
    strcpy(buffer, input); // Unsafe! No bounds checking.
    printf("You entered: %s\n", buffer);
}

int main(int argc, char **argv) {
    if (argc > 1) {
        vulnerable_function(argv[1]);
    }
    return 0;
}
The strcpy function is notoriously unsafe because it does not perform any bounds checking. It will continue copying bytes from input to buffer until it encounters a null terminator in the source string, regardless of the size of buffer. If an attacker provides an input string longer than 63 bytes (plus one for the null terminator), strcpy will write past the end of buffer. This overflow will first corrupt any other local variables, then the saved frame pointer, and finally, the return address.
By crafting a malicious input string, an attacker can overwrite the return address with the address of their own code (called shellcode), which they have also injected into the buffer. When vulnerable_function returns, instead of jumping back to main, the CPU will jump to the attacker’s shellcode, which could, for example, spawn a root shell (/bin/sh), giving the attacker complete control over the system.
A heap-based buffer overflow is conceptually similar but occurs with dynamically allocated buffers. Overwriting a buffer on the heap corrupts adjacent memory blocks. This can be used to overwrite data in other objects or, more powerfully, to corrupt the heap allocator’s metadata. By carefully overwriting these metadata structures, an attacker can trick the allocator into writing to arbitrary memory locations, achieving a similar outcome to a double-free exploit and potentially leading to code execution.
Modern compilers and operating systems have deployed several layers of defense against these attacks, such as Stack Canaries (which detect corruption of the stack before a function returns), Address Space Layout Randomization (ASLR) (which randomizes the memory locations of key areas like the stack and libraries, making it harder for an attacker to guess the address of their shellcode), and Non-Executable Memory (NX/XD bit) (which marks regions like the stack as non-executable, preventing injected code from running). However, no defense is perfect, and the fundamental solution remains writing memory-safe code.
Warning: Always use bounded string and memory functions like
strncpy,snprintf, andmemcpywith explicit size checks. Never trust the size of external input.
Practical Examples
Theory provides the foundation, but true understanding comes from hands-on practice. In this section, we will use a Raspberry Pi 5 running a standard Raspberry Pi OS (a Debian derivative) to compile, run, and debug code containing each of the memory errors we have discussed. We will primarily use Valgrind, a powerful instrumentation framework for dynamic analysis, and the GNU Compiler Collection (GCC) with its built-in AddressSanitizer (ASan).
Example 1: Detecting a Memory Leak with Valgrind
Let’s create a simple program with a deliberate memory leak.
File Structure
Create a directory for our examples:
mkdir ~/mem-examples
cd ~/mem-examples
Create a file named leak.c.
Code Snippet: leak.c
// leak.c: A program with a simple memory leak.
#include <stdlib.h>
#include <string.h>

void create_leak() {
    // Allocate 500 bytes on the heap.
    char *leaked_string = (char *) malloc(500);

    // We use the memory, but then lose the pointer by returning.
    // The memory is never freed.
    if (leaked_string != NULL) {
        strcpy(leaked_string, "This memory will be lost forever.");
    }
    // No call to free(leaked_string);
}

int main() {
    create_leak();
    return 0;
}
Build and Run Steps
1. Compile the code: We use gcc to compile our program. The -g flag includes debugging symbols, which allows Valgrind to give us precise line numbers.
gcc -g -o leak leak.c2. Run with Valgrind: To check for leaks, we invoke Valgrind with the memcheck tool and specify that we want a full leak summary.
valgrind --leak-check=full ./leakExpected Output and Analysis
Valgrind will produce a detailed report. The most important parts are the HEAP SUMMARY and the LEAK SUMMARY.
==106358== Memcheck, a memory error detector
==106358== Copyright (C) 2002-2022, and GNU GPL'd, by Julian Seward et al.
==106358== Using Valgrind-3.19.0 and LibVEX; rerun with -h for copyright info
==106358== Command: ./leak
==106358==
==106358==
==106358== HEAP SUMMARY:
==106358==     in use at exit: 500 bytes in 1 blocks
==106358==   total heap usage: 1 allocs, 0 frees, 500 bytes allocated
==106358==
==106358== 500 bytes in 1 blocks are definitely lost in loss record 1 of 1
==106358==    at 0x48850C8: malloc (vg_replace_malloc.c:381)
==106358==    by 0x120763: create_leak (leak.c:7)
==106358==    by 0x1207AB: main (leak.c:18)
==106358==
==106358== LEAK SUMMARY:
==106358==    definitely lost: 500 bytes in 1 blocks
==106358==    indirectly lost: 0 bytes in 0 blocks
==106358==      possibly lost: 0 bytes in 0 blocks
==106358==    still reachable: 0 bytes in 0 blocks
==106358==         suppressed: 0 bytes in 0 blocks
==106358==
==106358== For lists of detected and suppressed errors, rerun with: -s
==106358== ERROR SUMMARY: 1 errors from 1 contexts (suppressed: 0 from 0)
Valgrind’s output is unambiguous.
HEAP SUMMARY: It tells us that at the end of the program, 500 bytes were still “in use” from one allocation (1 allocs, 0 frees).LEAK SUMMARY: It categorizes this as “definitely lost”, which is the most severe category. This means we allocated memory and have no pointers to it anymore.- Stack Trace: Crucially, it provides a stack trace pointing directly to the source of the leak: line 7 of
leak.c, inside thecreate_leakfunction, which was called bymain. This makes it trivial to find and fix the bug by addingfree(leaked_string);before the function returns.
Example 2: Finding a Dangling Pointer with AddressSanitizer
Now, let’s tackle a use-after-free bug (a type of dangling pointer) and see how AddressSanitizer can catch it instantly.
Code Snippet: dangling.c
Create a file named dangling.c.
// dangling.c: Demonstrates a use-after-free error.
#include <stdio.h>
#include <stdlib.h>

int main() {
    int *ptr = (int *) malloc(sizeof(int));
    *ptr = 100;

    printf("Value before free: %d\n", *ptr);

    free(ptr); // ptr is now a dangling pointer

    printf("Attempting to access freed memory...\n");

    // This line will be caught by AddressSanitizer
    *ptr = 200; // Writing to freed memory

    printf("This line will likely not be reached.\n");

    return 0;
}
Build and Run Steps
1. Compile with AddressSanitizer: To enable ASan, we add the -fsanitize=address flag to our gcc command. We also keep -g for good debugging symbols.
gcc -g -fsanitize=address -o dangling dangling.cRun the instrumented program: Simply execute the compiled binary.
./danglingExpected Output and Analysis
Unlike Valgrind, which produces a report after the fact, ASan will cause the program to crash at the exact moment the error occurs, printing a detailed report to standard error.
Value before free: 100
Attempting to access freed memory...
=================================================================
==12389==ERROR: AddressSanitizer: heap-use-after-free on address 0x... at pc 0x... bp 0x... sp 0x...
WRITE of size 4 at 0x... thread T0
    #0 0x... in main /home/pi/mem-examples/dangling.c:16
    #1 0x... in __libc_start_main ../csu/libc-start.c:308
    #2 0x... in _start ( .../dangling+0x...)

0x... is located 0 bytes inside of 4-byte region [0x..., 0x...)
freed by thread T0 here:
    #0 0x... in __interceptor_free ( .../libasan.so.6+0x...)
    #1 0x... in main /home/pi/mem-examples/dangling.c:11

previously allocated by thread T0 here:
    #0 0x... in __interceptor_malloc ( .../libasan.so.6+0x...)
    #1 0x... in main /home/pi/mem-examples/dangling.c:6
=================================================================
ASan’s report is incredibly informative:
- Error Type: It clearly states
ERROR: AddressSanitizer: heap-use-after-free. - Offending Access: It specifies that a
WRITE of size 4occurred at line 16 ofdangling.c. - Allocation/Deallocation History: It shows that the memory was allocated at line 6 and, crucially, freed at line 11.
This immediate feedback loop makes ASan a superior tool for catching dynamic memory errors during development. It points to the exact cause, location, and history of the invalid memory access.
Example 3: Triggering and Analyzing a Buffer Overflow
Finally, let’s demonstrate a classic stack-based buffer overflow and see how modern system protections react.
Code Snippet: overflow.c
Create a file named overflow.c.
// overflow.c: A program with a vulnerable function.
#include <stdio.h>
#include <string.h>

void vulnerable_copy(const char *input) {
    char buffer[32];
    // Vulnerable call to strcpy
    strcpy(buffer, input);
    printf("Buffer content: %s\n", buffer);
}

int main(int argc, char **argv) {
    if (argc < 2) {
        printf("Usage: %s <string>\n", argv[0]);
        return 1;
    }
    printf("Passing oversized string to vulnerable function...\n");
    vulnerable_copy(argv[1]);
    printf("Function returned normally.\n");
    return 0;
}
Build and Run Steps
1. Compile the code: For this first attempt, we will compile it normally. Modern GCC enables stack protection by default.
gcc -g -o overflow overflow.c2. Run with malicious input: We will provide a string that is much larger than the 32-byte buffer.
./overflow "AAAAAAAAAAAAAAAAAAAAAAAAAAAAAAAAAAAAAAAAAAAAAAAAAAAAAAAAAAAA"Expected Output and Analysis (With Stack Protection)
The program will crash, but not because of a simple segmentation fault. You will see a specific message indicating a security feature was triggered.
assing oversized string to vulnerable function...
Buffer content: AAAAAAAAAAAAAAAAAAAAAAAAAAAAAAAAAAAAAAAAAAAAAAAAAAAAAAAAAAAA
Function returned normally.
Bus error
This message, *** stack smashing detected ***, is from the compiler’s stack canary protection (-fstack-protector). Before the strcpy call, a secret random value (the canary) was placed on the stack between the buffer and the return address. The overflow corrupted this canary. Before the function returns, the program checks if the canary value is intact. Since it has been overwritten, the program immediately aborts, preventing an attacker from hijacking the execution flow.
Disabling Protections for Demonstration
To see the raw effect of the overflow, we can explicitly disable the stack protector and mark the stack as executable.
Warning: Never do this in production code. This is for educational purposes only to understand the underlying mechanics of the vulnerability.
# Compile without stack protector and with an executable stack
gcc -g -fno-stack-protector -z execstack -o overflow_unsafe overflow.c
Now, run it again with the same long string:
./overflow_unsafe "AAAAAAAAAAAAAAAAAAAAAAAAAAAAAAAAAAAAAAAAAAAAAAAAAAAAAAAAAAAA"
This time, the output will be different:
Passing oversized string to vulnerable function...
Buffer content: AAAAAAAAAAAAAAAAAAAAAAAAAAAAAAAAAAAAAAAAAAAAAAAAAAAAAAAAAAAA
Segmentation fault
The program crashes with a Segmentation fault. This happens because we overwrote the return address with a string of ‘A’s (hexadecimal 0x41414141). When the function tried to return, it jumped to this invalid address, causing a hardware exception. An attacker would replace the ‘A’s with a valid address pointing to their shellcode.
Common Mistakes & Troubleshooting
Even with powerful tools, developers often fall into common traps when dealing with memory errors. Awareness of these pitfalls is the first step to avoiding them.
Exercises
These exercises are designed to be completed on your Raspberry Pi 5. They will reinforce the concepts and tool usage covered in this chapter.
The Leaky Accumulator:
Objective: Find and fix multiple memory leaks in a program that processes strings.
Guidance: The code below reads strings, concatenates them into a single large string, but leaks memory in the process. Use Valgrind to identify all the leaks and modify the code to free all allocated memory correctly.
Code (exercise1.c):
#include <stdio.h>
#include <stdlib.h>
#include <string.h>

// This function is supposed to append str2 to str1.
// It should return a new string and not modify str1.
char* append_string(const char* str1, const char* str2) {
    char* new_str = malloc(strlen(str1) + strlen(str2) + 1);
    strcpy(new_str, str1);
    strcat(new_str, str2);
    return new_str;
}

int main() {
    char* message = malloc(sizeof(char) * 15);
    strcpy(message, "Initial message");

    for (int i = 0; i < 5; i++) {
        message = append_string(message, ". Adding more.");
    }

    printf("Final message: %s\n", message);
    // Is all memory freed here?
    return 0;
}
Verification: A clean run of valgrind --leak-check=full ./exercise1 should report “0 bytes in 0 blocks are definitely lost.”
Dangling Pointer Detective:
Objective: Use AddressSanitizer to find a subtle use-after-free bug.
Guidance: The following code manages a “user” profile. There is a logic error where the user data is freed prematurely. Compile the code with -fsanitize=address and run it to trigger the ASan report. Analyze the report to understand the bug and fix it.
Code (exercise2.c):
#include <stdio.h>
#include <stdlib.h>
#include <string.h>

typedef struct {
    char* name;
    int id;
} user_t;

user_t* create_user(const char* name, int id) {
    user_t* user = malloc(sizeof(user_t));
    user->name = strdup(name); // strdup also uses malloc
    user->id = id;
    return user;
}

void free_user(user_t* user) {
    free(user->name);
    free(user);
}

int main() {
    user_t* current_user = create_user("embedded_guru", 101);
    char* user_name_backup = current_user->name;

    printf("User '%s' created with ID %d.\n", current_user->name, current_user->id);

    // The user is accidentally freed too early
    free_user(current_user);

    printf("User profile was deleted.\n");

    // Later, another part of the code tries to use the backed-up name
    printf("Checking backup name: %s\n", user_name_backup);

    return 0;
}
Verification: The corrected program should run without any ASan errors and without leaking memory.
Buffer Overflow Prevention:
Objective: Rewrite a vulnerable function using safe C library functions.
Guidance: The process_request function uses sprintf and strcpy in an unsafe manner. Your task is to rewrite it using snprintf and strncpy to prevent any possibility of a buffer overflow, even with malicious input.
Code (exercise3.c):
#include <stdio.h>
#include <string.h>

// This function is insecure.
void process_request(const char* username, const char* request_id) {
    char log_message[100];
    char user_data[50];

    strcpy(user_data, username); // Vulnerable

    sprintf(log_message, "User '%s' made request ID: %s", user_data, request_id); // Vulnerable

    printf("LOG: %s\n", log_message);
}

int main() {
    // Maliciously long inputs
    const char* bad_user = "this_is_a_very_long_username_designed_to_overflow_the_buffer";
    const char* bad_req = "REQ-99999999999999999999999999999999999999999999999999999";
    process_request(bad_user, bad_req);
    return 0;
}
Verification: The rewritten process_request function should not crash or show signs of overflow when run, even with the bad_user and bad_req inputs. The output log message should be cleanly truncated.
The Double-Free Dilemma:
Objective: Identify and correct a double-free error in a program with shared ownership of a pointer.
Guidance: In this program, two different data structures point to the same widget. The cleanup logic incorrectly frees the widget twice. Use Valgrind or ASan to detect the error. Refactor the code to establish clear ownership rules (e.g., only one structure is responsible for freeing the widget, or use reference counting) to fix the bug.
Code (exercise4.c):
#include <stdio.h>
#include <stdlib.h>

typedef struct { int id; } widget_t;
typedef struct { widget_t* w; } container_a;
typedef struct { widget_t* w; } container_b;

int main() {
    widget_t* shared_widget = malloc(sizeof(widget_t));
    shared_widget->id = 123;

    container_a c1 = { .w = shared_widget };
    container_b c2 = { .w = shared_widget };

    // Cleanup logic for container_a
    printf("Freeing widget from container A.\n");
    free(c1.w);

    // ... some time later ...

    // Cleanup logic for container_b
    printf("Freeing widget from container B.\n");
    free(c2.w); // BUG: Double-free!

    printf("Program finished.\n");
    return 0;
}
Verification: The corrected program must free the widget exactly once and run cleanly under Valgrind/ASan.
Summary
This chapter provided a deep dive into the most critical memory management errors encountered in embedded C programming. Mastering this topic is non-negotiable for any serious embedded systems developer.
- Memory Leaks occur when dynamically allocated memory is not freed, leading to gradual memory exhaustion. They are particularly dangerous in long-running embedded systems and can be reliably detected using Valgrind.
- Dangling Pointers are pointers that reference deallocated memory. Using them leads to undefined behavior, including data corruption and crashes. The best mitigation is to set pointers to
NULLafter freeing them. - Use-after-free and Double-Free errors are specific, dangerous types of dangling pointer bugs. They corrupt the heap’s internal state and can be exploited for security vulnerabilities. AddressSanitizer (ASan) is an excellent tool for catching these errors at runtime.
- Buffer Overflows involve writing past the boundaries of a buffer, corrupting adjacent memory. Stack-based overflows can overwrite a function’s return address, providing a vector for arbitrary code execution.
- Defensive Programming is key. Always use safe, bounds-checked functions like
strncpyandsnprintfinstead of their unsafe counterparts likestrcpyandsprintf. - Modern Tooling is essential. Compiling with full warnings (
-Wall), using static analyzers, and dynamically testing with Valgrind and AddressSanitizer should be a standard part of your development workflow.
By understanding the root causes of these errors and consistently applying the tools and techniques discussed, you can build embedded Linux applications that are significantly more robust, reliable, and secure.
Further Reading
- Valgrind Documentation: The official manual for the Valgrind tool suite. The documentation for Memcheck is particularly relevant.
- AddressSanitizer (ASan) Wiki: The official Clang/GCC wiki page detailing the usage and algorithm of AddressSanitizer.
- “Secure Coding in C and C++” (2nd Edition) by Robert C. Seacord: An authoritative book on secure programming practices, with extensive coverage of memory corruption vulnerabilities.
- Publisher: Addison-Wesley Professional
- OWASP – Buffer Overflow: The Open Web Application Security Project’s page on buffer overflows, providing a great overview from a security perspective.
- The GNU C Library (glibc) Manual – Dynamic Memory Allocation: The official documentation for
malloc,free, and related functions, providing insight into their expected behavior. - “Smashing The Stack For Fun And Profit” by Aleph One: The classic, seminal paper that brought stack buffer overflow vulnerabilities into the public consciousness. While dated, it is a foundational text for understanding the attack.
- Published in Phrack Magazine, Volume 7, Issue 49.
- Dietmar Kühl’s Stack Overflow Answer on
gotofor error handling in C: A well-reasoned, practical explanation of the proper use ofgotofor resource management.- Search for “Dietmar Kühl goto for error handling in C” on Stack Overflow.
