
Chapter 35: Dev. Environment: Native Debugging with GDB on RPi5
Chapter Objectives
Upon completing this chapter, you will be able to:
- Understand the fundamental role and architecture of the GNU Debugger (GDB) in an embedded Linux environment.
- Compile C/C++ applications with the necessary debug symbols for effective analysis.
- Control program execution using breakpoints, watchpoints, and stepping commands within a GDB session.
- Inspect the program state, including variables, memory, and the call stack, to diagnose faults.
- Implement a systematic, hands-on debugging workflow on a Raspberry Pi 5 to identify and resolve common programming errors.
- Debug multi-file C projects and attach GDB to already running processes.
Introduction
The transition from writing code to producing a reliable, functioning application is rarely a straight line in the lifecycle of any software project. This is especially true in embedded systems, where software interacts directly with hardware, and the consequences of a bug can range from a simple system freeze to catastrophic hardware failure. While previous chapters have focused on building your development environment and writing initial applications, this chapter addresses the inevitable next step: debugging. We will explore one of the most powerful and ubiquitous tools in the software development arsenal: the GNU Debugger (GDB).
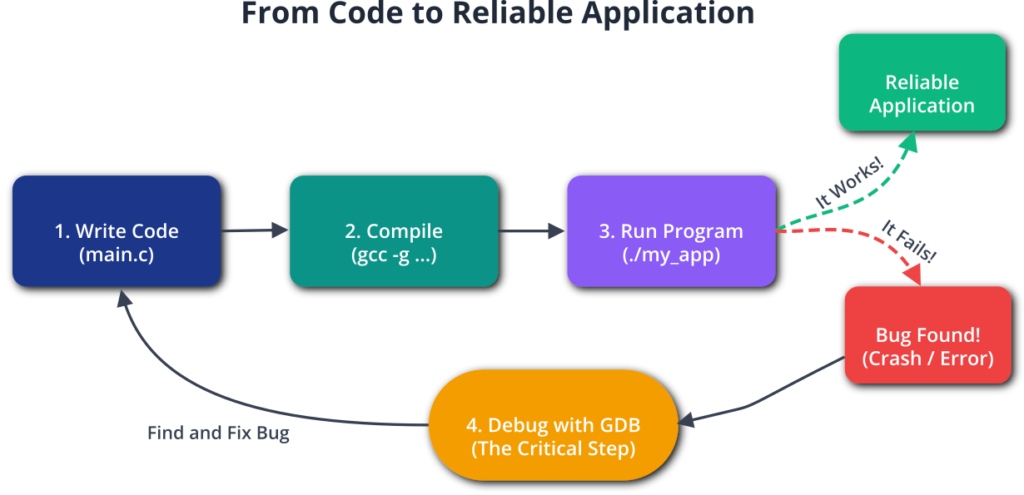
This chapter focuses on native debugging, a scenario where the debugger runs on the same machine as the program being tested—in our case, the Raspberry Pi 5. This approach is fundamental for its simplicity and immediacy, allowing you to directly probe a running application without the complexities of a cross-compilation toolchain or remote connections. You will learn not just what commands to type, but why they work. We will demystify how a debugger can pause a program in its tracks, peer into its memory, and even alter its behavior on the fly. By the end of this chapter, you will have moved beyond printf debugging and will possess the foundational skills to systematically dissect and solve complex software problems directly on your embedded target.
Technical Background
The Indispensable Role of a Debugger
In the early days of computing, debugging was a painfully physical process, sometimes involving the removal of actual insects from mechanical relays, which is apocryphally cited as the origin of the term “bug.” While our systems have evolved from room-sized mechanical contraptions to the credit-card-sized Raspberry Pi 5, the fundamental challenge remains: software does not always behave as intended. The most rudimentary form of debugging, which many programmers learn first, is inserting print statements (printf in C) to trace the flow of execution and inspect variable values. While simple, this method is deeply flawed. It requires modifying the source code for every new hypothesis, recompiling, and re-running the program. This cycle is slow, clutters the code, and can sometimes alter the very bug you are trying to find—a phenomenon known as a “Heisenbug.”
A source-level debugger like GDB provides a vastly superior alternative. It acts as a control program, a supervisor that can manage the execution of another program, referred to as the inferior or debuggee. This control is fine-grained and non-intrusive to the source code itself. A debugger allows you to start the target program, pause it at will, examine the state of all variables at that moment, and then continue execution line by line or until another point of interest is reached. It is the software equivalent of having a high-speed camera and a complete set of diagnostic tools for an engine, allowing you to inspect every component in slow motion at the precise moment of failure. This capability is not a luxury; it is an essential part of a professional developer’s toolkit, dramatically reducing the time it takes to identify the root cause of a defect.
How a Debugger Works: The Magic Demystified
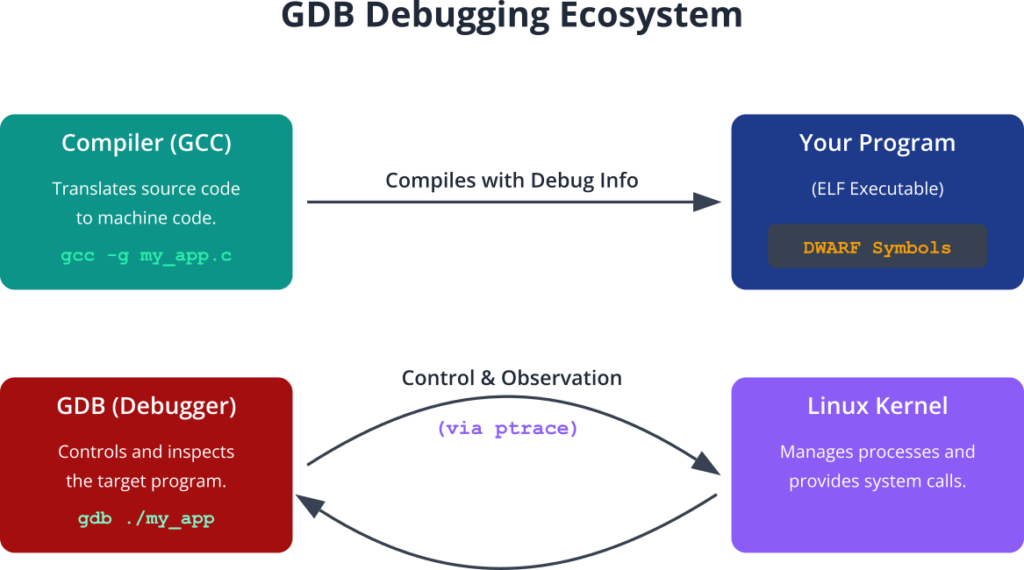
To an outside observer, a debugger’s ability to halt a running program and inspect its private state can seem like magic. In reality, it is a clever collaboration between the compiler, the operating system, and the debugger itself.
The process begins at compilation. When you compile your code, you must explicitly instruct the compiler to include debugging information. For the GNU Compiler Collection (GCC), this is done with the -g flag. This flag tells the compiler not to discard the rich metadata that connects the compiled machine code back to the original source code. This information is typically stored in a standardized format, most commonly DWARF (Debugging With Attributed Record Formats). The DWARF data is embedded within the final executable file (in the ELF format on Linux), containing details such as the mapping between machine instructions and source code line numbers, the names and types of variables, function names, and the structure of data types. Without this information, GDB can still debug the machine code, but it cannot relate it back to your main.c file; it would only see assembly instructions and memory addresses, which is far less intuitive.
When you run a program under GDB, the debugger uses a system call provided by the Linux kernel, ptrace (process trace), to take control of the target program. This powerful system call allows one process (the debugger) to observe and control another process (the inferior), read and write its memory and registers, and be notified of important events, like when the program crashes.
The Anatomy of a Breakpoint
The most common action in a debugging session is setting a breakpoint. A breakpoint is a deliberate pause point in your program. When you tell GDB break main.c:25, you are instructing it to halt the program just before line 25 is executed. GDB achieves this through a clever trick. It reads the machine instruction at the target location and replaces it in memory with a special instruction—on x86/ARM architectures, this is typically an INT 3 or TRAP instruction. This instruction is designed to signal the CPU to stop and notify the operating system. Because the debugger is tracing the process via ptrace, the kernel alerts GDB that a “trap” has occurred.
GDB catches this signal, halts the inferior program, and then consults its internal list of breakpoints. It sees that the trap corresponds to the breakpoint you set at main.c:25. Before handing control back to you, the user, GDB does a bit of housekeeping: it replaces the trap instruction with the original instruction it saved earlier. This way, when you eventually decide to continue execution, the program runs correctly, and the breakpoint remains transparent to the program’s logic. This is the mechanism behind software breakpoints.
%%{ init: { 'flowchart': { 'curve': 'basis' } } }%%
graph TD
    subgraph User Action
        A["User sets breakpoint<br><i>(gdb) break main.c:25</i>"]
    end

    subgraph GDB Internal Actions
        B{GDB finds memory address<br>for line 25}
        C["Saves the original instruction<br>at that address (e.g., <i>mov r0, #5</i>)"]
        D["Writes a 'trap' instruction<br>to that memory address"]
    end

    subgraph Program Execution
        E[Program runs until it<br>executes the 'trap' instruction]
    end

    subgraph Kernel & CPU
        F{{CPU Trap/Exception}}
        G[Kernel receives signal<br>from the CPU]
        H{"Kernel notifies GDB<br>(because of <i>ptrace</i>)"}
    end

    subgraph GDB Resumes Control
        I[GDB catches the signal]
        J["Restores the original instruction<br>(e.g., <i>mov r0, #5</i>)"]
        K["Program is now paused.<br>GDB waits for user input<br><i>(e.g., print, next, continue)</i>"]
    end

    A --> B;
    B --> C;
    C --> D;
    D --> E;
    E --> F;
    F --> G;
    G --> H;
    H --> I;
    I --> J;
    J --> K;

    %% Styling
    classDef startNode fill:#1e3a8a,stroke:#1e3a8a,stroke-width:2px,color:#ffffff;
    classDef processNode fill:#0d9488,stroke:#0d9488,stroke-width:1px,color:#ffffff;
    classDef systemNode fill:#8b5cf6,stroke:#8b5cf6,stroke-width:1px,color:#ffffff;
    classDef checkNode fill:#ef4444,stroke:#ef4444,stroke-width:1px,color:#ffffff;
    classDef endNode fill:#10b981,stroke:#10b981,stroke-width:2px,color:#ffffff;

    class A startNode;
    class B,C,D,I,J processNode;
    class E,K endNode;
    class F,G,H systemNode;
Modern CPUs also support a limited number of hardware breakpoints. These are configured directly in the CPU’s debug registers. Instead of modifying the code, you tell the CPU to watch a specific memory address. When the instruction pointer register matches that address, the CPU itself triggers a debug exception. Hardware breakpoints are powerful because they don’t modify the program’s code in memory, which is essential for debugging code in read-only memory (ROM) or self-modifying code. They are also used to implement watchpoints.
Watchpoints: Your Data’s Guardian Angel
While a breakpoint stops execution at a specific location, a watchpoint stops execution when specific data changes. This is an incredibly powerful tool for tracking down memory corruption bugs, where a variable is being modified by an unknown part of the code. For example, if you have a global variable int status that is being mysteriously overwritten, you can issue the command watch status in GDB.
sequenceDiagram
    participant User
    participant GDB
    participant CPU/Hardware
    participant Program

    User->>GDB: watch my_variable
    GDB->>CPU/Hardware: Configure debug register<br>to monitor address of 'my_variable'
    GDB->>Program: continue

    loop Program Execution
        Program->>Program: Executes code...
    end

    Program->>CPU/Hardware: Instruction writes to 'my_variable'

    CPU/Hardware-->>GDB: Triggers Debug Exception!

    GDB->>GDB: Catches exception, pauses Program
    GDB->>User: Watchpoint triggered:<br>Old value: 10<br>New value: 50<br>Paused at culprit_line.c:42

    %% Styling
    %% Note: Mermaid styling is limited in sequence diagrams compared to flowcharts
    %% but we can use notes and annotations for clarity.
GDB will typically use hardware debug registers to implement the watchpoint. You instruct the CPU to monitor the memory address corresponding to the status variable. The moment any instruction writes to that address, the CPU triggers a debug exception. GDB catches this, reports that the watchpoint was triggered, and shows you the new and old values of the variable. Crucially, it stops the program at the exact line of code after the one that made the change, allowing you to inspect the call stack and understand the context in which the modification occurred. Because the number of hardware debug registers is limited (typically 4 on many architectures), you can only have a small number of hardware watchpoints active at once.
Navigating the Program State: The Call Stack and Variables
When a program is paused at a breakpoint, your first task is to understand the context. Where is the program, and how did it get here? The primary tool for this is the backtrace. The call stack (or simply “stack”) is a region of memory that keeps track of the active functions in a program. When main() calls function_A(), and function_A() calls function_B(), the stack holds information about each of these calls. It stores the return address (where to resume execution in the calling function), local variables for each function, and passed arguments.
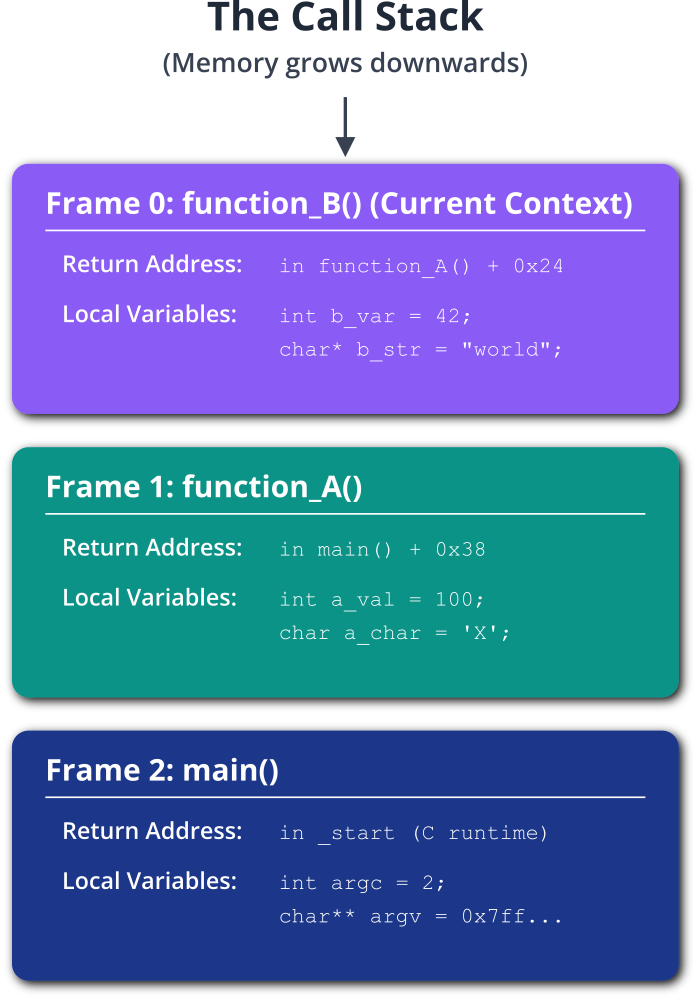
The backtrace (or bt) command in GDB displays this stack. It shows you the chain of function calls that led to the current location, which is invaluable for understanding program flow. You can switch between different stack frames using the frame command to inspect the local variables and arguments of any function in the call chain, effectively letting you travel back in time to see the state of the program at each stage of the call sequence.
Once in the correct frame, you can use commands like print (p) to inspect the value of a variable at that moment. For example, p my_variable will show you its current value. If you want to continuously monitor a variable, the display command will print its value every time the program stops. You can even modify the program’s state on the fly. The command set var my_variable = 10 will change the value in memory, allowing you to test different scenarios without recompiling. For instance, if you suspect an error occurs only when a counter reaches a specific value, you can set a breakpoint just before the check, manually change the counter’s value, and continue execution to confirm your hypothesis. This interactive “what-if” analysis is a hallmark of powerful debugging sessions.
Practical Examples
Theory provides the foundation, but skill is built through practice. In this section, we will walk through a complete, hands-on debugging session on the Raspberry Pi 5. We will start with a buggy program, compile it with debug symbols, and use GDB to hunt down and fix the errors.
The Target Program: A Flawed String Processor
Let’s create a simple C program that contains a few common but non-obvious bugs. The program is intended to take a string, convert it to uppercase, and then reverse it.
Create a file named string_bugs.c on your Raspberry Pi 5 using your preferred text editor (like nano or vim) and enter the following code:
// string_bugs.c
// A simple program with intentional bugs for debugging practice.
#include <stdio.h>
#include <string.h>
#include <ctype.h>
#include <stdlib.h>

// Converts a string to uppercase
void to_uppercase(char *str) {
    for (int i = 0; i <= strlen(str); i++) {
        str[i] = toupper(str[i]);
    }
}

// Reverses a string in place
void reverse_string(char *str) {
    int start = 0;
    int end = strlen(str) - 1;
    char temp;

    while (start <= end) {
        temp = str[start];
        str[start] = str[end];
        str[end] = temp;
        start++;
        end--;
    }
}

int main(int argc, char *argv[]) {
    if (argc < 2) {
        printf("Usage: %s <string>\n", argv[0]);
        return 1;
    }

    char *input_string = argv[1];
    char *processed_string;

    // Allocate memory and copy the input string
    processed_string = (char *)malloc(strlen(input_string)); // Bug #1 is here
    strcpy(processed_string, input_string);

    printf("Original string:   %s\n", processed_string);

    to_uppercase(processed_string);
    printf("Uppercase string:  %s\n", processed_string);

    reverse_string(processed_string);
    printf("Reversed string:   %s\n", processed_string);

    free(processed_string);

    // Attempt to access freed memory
    processed_string[0] = 'A'; // Bug #2 is here

    return 0;
}
This code has at least two critical bugs that we will find using GDB.
Build and Configuration Steps
First, we need to compile this program. The key is to use the -g flag with GCC to include the DWARF debug symbols in the final executable. Without this, GDB will be of limited use.
Open a terminal on your Raspberry Pi 5 and execute the following command:
gcc -g -o string_bugs string_bugs.c
gcc: The GNU C Compiler.-g: This is the crucial flag that tells the compiler to include debug information.-o string_bugs: This specifies the output filename for our executable.string_bugs.c: This is our source file.
If you run the program now, you might see it crash.
./string_bugs "Hello"
Original string:   Hello
Uppercase string:  HELLO
Reversed string:   OLLEH
Segmentation fault
A segmentation fault is a common error that occurs when a program tries to access a memory location that it’s not allowed to access. Our printf statements show that the program gets quite far before crashing. Let’s use GDB to find out exactly where and why.
Launching and Using GDB
To start a debugging session, you launch GDB and provide the name of the executable you want to debug as an argument.
gdb ./string_bugs
You will be greeted by the GDB prompt (gdb). The program has been loaded into the debugger but has not yet started running.
1. Setting a Breakpoint and Running the Program
The segmentation fault happens at the end. Let’s start by running the program inside GDB to confirm the crash. We use the run (or r) command. Since our program expects a command-line argument, we provide it to the run command.
(gdb) run "Hello"
Starting program: /home/pi/string_bugs "Hello"
Original string:   Hello
Uppercase string:  HELLO
Reversed string:   OLLEH

Program received signal SIGSEGV, Segmentation fault.
0x000000000040135c in main (argc=2, argv=0x7fffffffdc38) at string_bugs.c:48
48	    processed_string[0] = 'A'; // Bug #2 is here
GDB runs the program and helpfully stops exactly at the line that caused the crash. It tells us it received SIGSEGV (Segmentation Fault) at line 48 of string_bugs.c. The offending line is processed_string[0] = 'A';. This is our second bug. The program is trying to write to memory that has already been released by the free(processed_string); call on the previous line. This is a classic “use-after-free” bug.
2. Finding the First Bug
But what about the first bug mentioned in the code comments? It’s more subtle and doesn’t cause an immediate crash on this run, but it’s a ticking time bomb. Let’s restart the program from the beginning using the run command again. GDB will ask if you want to start from the beginning.
(gdb) run "Hello"
The program being debugged has been started already.
Start it from the beginning? (y or n) y
Starting program: /home/pi/string_bugs "Hello"
Let’s set a breakpoint at the start of the to_uppercase function to inspect the string. We use the break (or b) command.
(gdb) b to_uppercase
Breakpoint 1 at 0x4011bd: file string_bugs.c, line 9.
(gdb) run "Hello"
Starting program: /home/pi/string_bugs "Hello"
Original string:   Hello

Breakpoint 1, to_uppercase (str=0x4052a0 "Hello") at string_bugs.c:9
9	    for (int i = 0; i <= strlen(str); i++) {
The program stops at the entry to to_uppercase. We can now inspect the state. Let’s print the string str passed to the function.
(gdb) p str
$1 = 0x4052a0 "Hello"
It looks correct. Now let’s examine the loop condition: i <= strlen(str). The length of “Hello” is 5. The characters are at indices 0, 1, 2, 3, and 4. The null terminator \0 is at index 5. This loop will run for i values 0, 1, 2, 3, 4, and 5. When i is 5, str[5] is the null terminator. The toupper function’s behavior on a null character is undefined, and more importantly, our loop is overwriting the null terminator, which is a classic bug.
Let’s also investigate the memory allocation at line 35: malloc(strlen(input_string)). strlen("Hello") is 5. So we allocate 5 bytes. But to store the string “Hello”, we need 6 bytes: 5 for the characters and 1 for the null terminator. The strcpy on the next line will therefore write the null terminator one byte past the end of the allocated buffer. This is a buffer overflow.
Let’s confirm this. We’ll restart and break at line 36.
(gdb) b 36
Breakpoint 2 at 0x4012e8: file string_bugs.c, line 36.
(gdb) run "Hello"
The program being debugged has been started already.
Start it from the beginning? (y or n) y
Starting program: /home/pi/string_bugs "Hello"

Breakpoint 2, main (argc=2, argv=0x7fffffffdc38) at string_bugs.c:36
36	    strcpy(processed_string, input_string);
Now let’s print the value of strlen(input_string).
(gdb) p strlen(input_string)
$2 = 5
GDB confirms that malloc was called with an argument of 5. This is our bug #1. It should have been malloc(strlen(input_string) + 1). Because of how memory allocators work, this small overflow didn’t cause an immediate crash but corrupted the memory heap, which is a very dangerous kind of bug.

3. Stepping Through Code
Let’s go back to our breakpoint inside to_uppercase and see how to step through code.
(gdb) b to_uppercase
Breakpoint 1 at 0x4011bd: file string_bugs.c, line 9.
(gdb) run "Hello"
...
Breakpoint 1, to_uppercase (str=0x4052a0 "Hello") at string_bugs.c:9
9	    for (int i = 0; i <= strlen(str); i++) {
There are two main stepping commands:
next(orn): Execute the current line and stop at the next line in the current function. If the current line is a function call, it executes the entire function and stops after it returns.step(ors): Execute the current line. If the line contains a function call, it steps into that function and stops at its first line.
Let’s use next to go to the next line.
(gdb) n
10	        str[i] = toupper(str[i]);
We are now inside the loop. Let’s print the loop counter i.
(gdb) p i
$3 = 0
Let’s execute this line and see the string change.
(gdb) n
9	    for (int i = 0; i <= strlen(str); i++) {
(gdb) p str
$4 = 0x4052a0 "Hello"
Wait, the string didn’t change. str[0] is still ‘H’. This is because the toupper function returns the uppercase character, it doesn’t modify the string in place. And str[i] was already uppercase. Let’s continue the loop until i is 1. We use the continue (or c) command to resume execution until the next breakpoint. Since we are in a loop, the same breakpoint will be hit again.
(gdb) c
Continuing.

Breakpoint 1, to_uppercase (str=0x4052a0 "hELLO") at string_bugs.c:9
9	    for (int i = 0; i <= strlen(str); i++) {
Ah, I made a mistake in my manual execution. Let’s restart and try again. The toupper function is being assigned. Let’s re-examine.
(gdb) run "Hello"
...
Breakpoint 1, to_uppercase (str=0x4052a0 "Hello") at string_bugs.c:9
9	    for (int i = 0; i <= strlen(str); i++) {
(gdb) n
10	        str[i] = toupper(str[i]);
(gdb) p i
$5 = 0
(gdb) n
9	    for (int i = 0; i <= strlen(str); i++) {
(gdb) p str
$6 = 0x4052a0 "Hello"
The first character ‘H’ is already uppercase, so nothing changes. Let’s set a conditional breakpoint to stop only when i is 1.
(gdb) b 10 if i == 1
Breakpoint 3 at 0x4011d6: file string_bugs.c, line 10.
(gdb) c
Continuing.

Breakpoint 3, to_uppercase (str=0x4052a0 "Hello") at string_bugs.c:10
10	        str[i] = toupper(str[i]);
(gdb) p i
$7 = 1
(gdb) n
9	    for (int i = 0; i <= strlen(str); i++) {
(gdb) p str
$8 = 0x4052a0 "HEllo"
Success! The ‘e’ was converted to ‘E’. Conditional breakpoints are extremely useful for stopping only when a specific condition is met, saving you from manually stepping through hundreds of loop iterations.
Correcting the Code
Based on our GDB session, we’ve identified three issues:
- Memory Allocation:
mallocneeds+ 1for the null terminator. - Loop Boundary: The loop in
to_uppercaseshould use<instead of<=to avoid touching the null terminator. - Use-After-Free: The access to
processed_stringafterfree()must be removed.
Here is the corrected string_bugs_fixed.c:
// string_bugs_fixed.c
#include <stdio.h>
#include <string.h>
#include <ctype.h>
#include <stdlib.h>

// Converts a string to uppercase
void to_uppercase(char *str) {
    // Corrected loop condition: < instead of <=
    for (int i = 0; i < strlen(str); i++) {
        str[i] = toupper(str[i]);
    }
}

// Reverses a string in place
void reverse_string(char *str) {
    int start = 0;
    int end = strlen(str) - 1;
    char temp;

    while (start < end) { // Can be < or <=, < is slightly more efficient
        temp = str[start];
        str[start] = str[end];
        str[end] = temp;
        start++;
        end--;
    }
}

int main(int argc, char *argv[]) {
    if (argc < 2) {
        printf("Usage: %s <string>\n", argv[0]);
        return 1;
    }

    char *input_string = argv[1];
    char *processed_string;

    // Corrected allocation: +1 for the null terminator
    processed_string = (char *)malloc(strlen(input_string) + 1);
    if (processed_string == NULL) {
        perror("malloc failed");
        return 1;
    }
    strcpy(processed_string, input_string);

    printf("Original string:   %s\n", processed_string);

    to_uppercase(processed_string);
    printf("Uppercase string:  %s\n", processed_string);

    reverse_string(processed_string);
    printf("Reversed string:   %s\n", processed_string);

    free(processed_string);

    // Removed the use-after-free bug
    // processed_string[0] = 'A';

    return 0;
}
Compile and run the fixed version:
gcc -g -o string_bugs_fixed string_bugs_fixed.c
./string_bugs_fixed "Success"
Original string:   Success
Uppercase string:  SUCCESS
Reversed string:   SSECUCUS
The program now runs without a segmentation fault and produces the correct output.
Common Mistakes & Troubleshooting
Even with a powerful tool like GDB, developers can fall into common traps. Being aware of these can save you hours of frustration.
Exercises
1. Find the Infinite Loop: The following program is supposed to print numbers from 10 down to 1, but it never terminates. Using GDB, find the logical error in the loop condition.
// exercise1.c
#include <stdio.h>

int main() {
    for (unsigned int i = 10; i >= 0; i--) {
        printf("i = %u\n", i);
    }
    return 0;
}
Objective: Use a breakpoint and inspect the variable i on each iteration to understand why the loop condition i >= 0 is always true. (Hint: Think about what happens when an unsigned int with a value of 0 is decremented).
2. The Corrupted Pointer: This program crashes with a segmentation fault. The pointer data_ptr is being assigned a value, but something is wrong with it.
// exercise2.c
#include <stdio.h>
#include <stdlib.h>

void initialize_data(int *ptr) {
    ptr = (int*)malloc(sizeof(int) * 10);
    printf("Initialized ptr inside function: %p\n", ptr);
}

int main() {
    int *data_ptr = NULL;
    initialize_data(data_ptr);
    printf("data_ptr in main: %p\n", data_ptr);
    data_ptr[0] = 100; // Crash!
    free(data_ptr);
    return 0;
}
Objective: Set breakpoints in main and initialize_data. Step through the code and print the value of data_ptr in main and ptr in the function to understand why data_ptr remains NULL in main. (Hint: C passes arguments by value).
3. Using a Watchpoint: In the program below, the global_counter is modified by function_b, but it’s not obvious when looking at main.
// exercise3.c
#include <stdio.h>

int global_counter = 0;

void function_a() { global_counter += 10; }
void function_b() { global_counter = 0; }
void function_c() { global_counter *= 2; }

int main() {
    function_a(); // counter = 10
    function_c(); // counter = 20
    function_a(); // counter = 30
    function_b(); // counter = 0
    function_c(); // counter = 0
    printf("Final counter: %d\n", global_counter);
    return 0;
}
Objective: Use a GDB watchpoint on global_counter to make the debugger stop every time its value changes. Use the backtrace command when the watchpoint triggers to see which function is responsible for the change.
4. Debugging a Multi-File Project: Create two files.main.c:
// main.c
#include <stdio.h>
#include "utils.h"

int main() {
    int result = add(5, 3);
    printf("Result is: %d\n", result);
    result = subtract(5, 10);
    printf("Result is: %d\n", result);
    return 0;
}
```utils.c`:
```c
// utils.c
int add(int a, int b) { return a + b; }
// Buggy function
int subtract(int a, int b) { return a + b; }
```utils.h`:
```c
// utils.h
int add(int a, int b);
Objective: Compile both .c files with -g and link them into a single executable. Use GDB to set a breakpoint in utils.c and step through the subtract function to find the bug.
Compilation Hint: gcc -g -o multi_proj main.c utils.c
%%{ init: { 'flowchart': { 'curve': 'catmullRom' } } }%%
graph TD
    subgraph Setup
        A[Start: Write code<br><i>main.c, utils.c, utils.h</i>]
    end

    subgraph Compilation
        B["Compile all source files with <b>-g</b><br><i>gcc -g -o multi_proj main.c utils.c</i>"]
    end

    subgraph GDB Session
        C["Launch GDB with the executable<br><i>gdb ./multi_proj</i>"]
        D{"Set breakpoints in any file<br><i>(gdb) b utils.c:subtract</i>"}
        E["Run the program with arguments<br><i>(gdb) run</i>"]
    end

    subgraph Debugging Loop
        F{Program stops at breakpoint}
        G["Inspect variables and state<br><i>(gdb) p a</i><br><i>(gdb) p b</i>"]
        H{Is the bug found?}
        I["Use <b>step</b>, <b>next</b>, <b>continue</b><br>to navigate code"]
    end

    subgraph Resolution
        J[Identify the logical error<br><i>e.g., return a + b; instead of a - b;</i>]
        K[Exit GDB, fix the code in <i>utils.c</i>]
        L[End: Recompile and test again]
    end

    A --> B;
    B --> C;
    C --> D;
    D --> E;
    E --> F;
    F --> G;
    G --> H;
    H -- No --> I;
    I --> F;
    H -- Yes --> J;
    J --> K;
    K --> L;

    %% Styling
    classDef startNode fill:#1e3a8a,stroke:#1e3a8a,stroke-width:2px,color:#ffffff;
    classDef processNode fill:#0d9488,stroke:#0d9488,stroke-width:1px,color:#ffffff;
    classDef decisionNode fill:#f59e0b,stroke:#f59e0b,stroke-width:1px,color:#ffffff;
    classDef endNode fill:#10b981,stroke:#10b981,stroke-width:2px,color:#ffffff;
    classDef ioNode fill:#8b5cf6,stroke:#8b5cf6,stroke-width:1px,color:#ffffff;

    class A startNode;
    class B,C,D,E,F,G,I,J,K processNode;
    class H decisionNode;
    class L endNode;
5. Attaching to a Running Process: Sometimes a bug only appears after a program has been running for a long time. It’s impractical to run it from the start in GDB. Instead, you can attach GDB to an already running process.
Objective: Run exercise1 in a terminal (./exercise1). It will start printing numbers in an infinite loop. Open a second terminal. Find the Process ID (PID) of exercise1 using pgrep exercise1. Attach GDB to it using gdb -p <PID>. Once attached, the process will be paused. Use GDB to inspect the state and figure out what’s wrong. Use the detach command to let the process continue running when you are done.
Summary
- Native Debugging: Debugging an application on the same system where it is being executed (the “target”). On the Raspberry Pi 5, this is a powerful and direct method for finding bugs.
- Debug Symbols: Compiling with the
-gflag is essential. It embeds DWARF information into the executable, allowing GDB to map machine code back to your original source code lines, variable names, and types. - GDB Basics: You start a session with
gdb ./program. Theruncommand starts execution,breaksets a breakpoint, andcontinueresumes execution until the next breakpoint. - Execution Control:
nextsteps over function calls, whilestepsteps into them.finishcompletes the current function and returns to the caller. Conditional breakpoints (break ... if ...) allow you to stop only when a specific state is reached. - State Inspection:
printshows the value of a variable once.displayshows it every time the program stops.backtracereveals the call stack, showing how the program reached its current location. - Watchpoints: A watchpoint (
watch my_var) is a powerful tool that stops execution whenever a variable’s value changes, which is ideal for tracking down memory corruption. - Common Pitfalls: Always compile with
-gand-O0for debugging. Be mindful of the difference betweenstepandnext, and always recompile after making code changes to avoid debugging a stale executable.
Further Reading
- GDB Documentation: The official and most authoritative source for all GDB commands and features.
- DWARF Standard: For those interested in the low-level details of how debug information is stored.
- Linux
ptraceSystem Call: The man page for the underlying kernel mechanism that powers GDB. - Medium Post: A great resource for professional embedded systems practices.
- Raspberry Pi Documentation: Official hardware and software documentation for the development platform.
