
Chapter 45: Remote Debugging C/C++ Apps on RPi5 w GDBServer & VS Code
Chapter Objectives
By the end of this chapter, you will be able to:
- Understand the client-server architecture of the GNU Debugger (GDB) and the specific roles of the GDB client and GDBServer.
- Configure a Raspberry Pi 5 (target) and a development workstation (host) for a cross-compilation and remote debugging workflow.
- Implement a remote debugging session by launching a C/C++ application with GDBServer on the target and connecting to it from a GDB client.
- Integrate the GDB client with Visual Studio Code to create a powerful, graphical debugging environment for embedded applications.
- Debug a C/C++ application remotely by setting breakpoints, stepping through code, inspecting variables, and examining memory.
- Identify and resolve common issues related to network configuration, symbol mismatches, and permissions in a remote debugging setup.
Introduction
In the initial stages of learning programming, debugging often involves inserting printf statements or using simple, integrated debuggers that run on the same machine where the code is written and executed. While effective for simple applications, this approach quickly becomes untenable in the world of embedded Linux development. Embedded systems, like the Raspberry Pi 5, often operate in resource-constrained environments, may lack a graphical interface (running “headless”), and directly interact with hardware that is not present on the developer’s workstation. How does one debug a program that controls a robot’s motor or reads from a sensor when the program only runs on the robot itself?
The answer lies in remote debugging. This powerful technique separates the debugging interface from the program execution. A lightweight debugging agent runs on the embedded target, while a full-featured debugger runs on a powerful host development machine. This chapter introduces the industry-standard tool for this task: the GNU Debugger (GDB) in its client-server configuration. We will explore the elegant architecture of GDB and GDBServer, which allows us to pause, inspect, and control an application running on our Raspberry Pi 5 from a familiar development environment. By integrating this workflow into Visual Studio Code, we will construct a professional-grade debugging setup that provides deep insight into our application’s behavior, right down to the hardware level. This chapter will bridge the gap between writing code and understanding its real-world execution, a fundamental skill for any embedded systems engineer.
Technical Background
The GDB Client-Server Architecture: A Tale of Two Processes
To truly appreciate the power of remote debugging, one must first understand the architecture that enables it. The GNU Debugger is not a monolithic entity; it is designed with a brilliant separation of concerns that manifests as a client-server model. This model is the cornerstone of professional embedded systems debugging.
The two key components in this architecture are the GDB client and the GDBServer.
The GDB client is the heavyweight component of the duo. This is the full-featured debugger that you, the developer, interact with. It runs on your host machine (e.g., a laptop or desktop running Linux, macOS, or Windows). The client’s primary responsibility is to manage the debugging session. It is aware of the source code, holds the symbol table information generated during compilation, and provides the command-line interface (or graphical front-end) for setting breakpoints, stepping through code, and inspecting variables. When you compile your application with the -g flag, you are creating this vital symbolic information—mapping machine code back to your C++ or C source lines—for the GDB client to interpret. Without this, the debugger would only see a sea of assembly instructions, making meaningful source-level debugging impossible.
Conversely, the GDBServer is a lightweight, minimalist program designed to run on the embedded target—in our case, the Raspberry Pi 5. Its purpose is singular and focused: to act as a remote control for the application being debugged. GDBServer knows nothing about your source code or variable names. It operates at a much lower level. When launched, it attaches to the target application, effectively taking control of its execution. It then opens a TCP network socket and patiently listens for a connection from a GDB client.
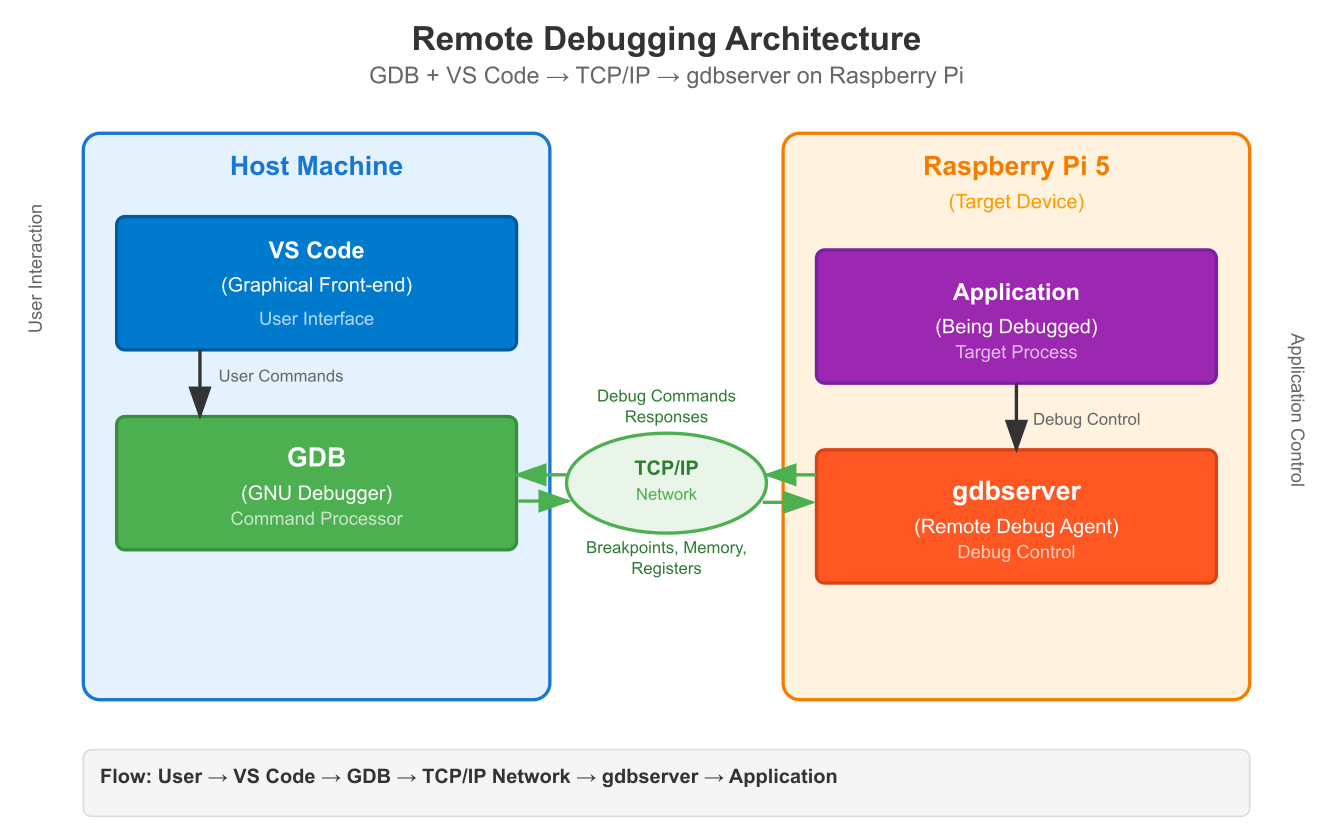
Once the GDB client connects, a conversation begins. The client sends high-level commands like “set a breakpoint at line 52 of main.cpp” or “step over the next function call.” The GDB client, using the symbol table, translates “line 52” into a specific memory address. It then sends a compact, low-level command to GDBServer via the GDB Remote Serial Protocol (RSP). This protocol is a simple, text-based command set designed for efficiency. For instance, the client might send a command like Z0,address,1 to insert a software breakpoint at a given address.
%%{init: {'theme': 'base', 'themeVariables': { 'fontFamily': 'Open Sans'}}}%%
sequenceDiagram
    actor Developer
    participant VSCode as "VS Code (UI)"
    participant GDBClient as "GDB Client<br>(gdb-multiarch)"
    participant GDBServer as "GDBServer<br>on RPi5"
    participant App as "Target App<br>(./remote_app)"

    Developer->>VSCode: 1. Clicks to set breakpoint on line 52
    VSCode->>GDBClient: breakpoint main.cpp:52
    GDBClient->>GDBServer: 2. Translates to address & sends RSP command<br><i>(e.g., Z0,0x400890,1)</i>
    GDBServer->>App: 3. Modifies memory at 0x400890<br>to insert breakpoint instruction
    GDBServer-->>GDBClient: Acknowledges (OK)
    GDBClient-->>VSCode: Breakpoint set
    VSCode-->>Developer: Red dot appears on line 52

    Developer->>VSCode: 4. Clicks "Continue" (F5)
    VSCode->>GDBClient: continue
    GDBClient->>GDBServer: 5. Sends "continue" command (c)
    GDBServer->>App: 6. Resumes execution

    Note over App: Program runs...

    App->>GDBServer: 7. Hits breakpoint, triggers exception
    GDBServer->>App: 8. Halts application execution
    GDBServer->>GDBClient: 9. Sends stop notification<br><i>(e.g., S05)</i>

    GDBClient->>VSCode: 10. Notifies UI of stop event
    VSCode-->>Developer: Execution pauses, line 52 is highlighted

    Developer->>VSCode: 11. Hovers over 'iteration' variable
    VSCode->>GDBClient: -data-evaluate-expression iteration
    GDBClient->>GDBServer: 12. Requests memory/register contents
    GDBServer->>App: 13. Reads value from memory
    App-->>GDBServer: Raw data (e.g., 0x01)
    GDBServer-->>GDBClient: Sends raw data back
    GDBClient-->>VSCode: 14. Interprets data using symbols<br>Returns "iteration = 1"
    VSCode-->>Developer: Displays tooltip: "iteration: 1"
GDBServer receives this command and carries it out on behalf of the client. It modifies the application’s memory to insert the breakpoint instruction, resumes the program’s execution, and waits. When the program counter hits that breakpoint, the CPU triggers an exception. GDBServer catches this exception, halts the application, and sends a notification packet back to the GDB client, essentially saying, “We’ve stopped at the location you requested.” The GDB client can then query the state of the machine, asking GDBServer for the contents of CPU registers or specific memory locations. GDBServer retrieves this raw data from the target’s operating system and sends it back. The client then uses the symbol table to present this raw data in a human-readable format, such as the value of a local variable or the current stack trace.
This separation is profoundly effective. It keeps the target’s footprint minimal—GDBServer is a small executable with low overhead. All the complex work of symbol parsing and user interaction is offloaded to the powerful host machine. This architecture ensures that the act of debugging has the least possible impact on the performance and resources of the embedded system itself, a critical consideration when debugging real-time or resource-sensitive applications.
The Role of the Cross-Compiler
A crucial piece of this puzzle is the cross-compiler. As we have discussed in previous chapters, you cannot typically use the compiler on your x86-64 development machine to create an executable that will run on the Raspberry Pi’s ARM-based processor. The instruction sets are fundamentally incompatible.
A cross-compiler is a special compiler that runs on one architecture (the host, e.g., x86-64) but generates machine code for a different architecture (the target, e.g., AArch64 for the Raspberry Pi 5). When we build our application for debugging, we will use a cross-compiler toolchain. This toolchain includes not only the compiler (e.g., aarch64-linux-gnu-g++) but also the linker, binutils, and, importantly, a version of the GDB client that understands the target’s architecture.
When we invoke the cross-compiler with the -g flag, it embeds the debugging symbols into the executable file. This file is then copied to the target device. The GDB client on the host machine needs access to this exact same executable file (or a copy of it) to read the symbols. When GDBServer on the target reports that the program has stopped at memory address 0x400890, the GDB client on the host looks into its copy of the executable and determines, “Ah, 0x400890 corresponds to line 75 in motor_control.cpp.” This is why it is critical that the executable on the host and target are identical.
Integrating with Visual Studio Code
While using GDB from the command line is powerful, it can be cryptic and has a steep learning curve. This is where a modern IDE like Visual Studio Code provides an enormous productivity boost. VS Code does not replace GDB; it acts as a sophisticated graphical front-end for it.
The official C/C++ extension for VS Code has built-in support for GDB. It allows you to configure a launch.json file, which is a set of instructions that tells VS Code how to start a debugging session. Instead of manually typing GDB commands, you define these steps in a structured JSON format. You can specify the path to your cross-compiler’s GDB client, the executable file containing the symbols, and the IP address and port where GDBServer is listening on the Raspberry Pi.
When you click “Start Debugging” in VS Code, the C/C++ extension launches the specified GDB client in the background. It then uses the settings from launch.json to automatically issue the necessary GDB commands to connect to the remote GDBServer. From that point on, you can use VS Code’s intuitive graphical interface to:
- Set Breakpoints: Simply click in the gutter next to a line number.
- Step Through Code: Use on-screen buttons for Step Over, Step Into, and Step Out.
- Inspect Variables: View local and global variables, which update automatically as you step through the code.
- View the Call Stack: See the chain of function calls that led to the current execution point.
- Examine Memory: Inspect raw memory at any address.
- View Registers: See the contents of the CPU registers.
VS Code translates these graphical interactions into the corresponding GDB commands and handles the communication with the GDB client transparently. This creates a seamless, efficient, and user-friendly debugging experience that abstracts away the complexities of the underlying command-line interface, allowing you to focus entirely on finding and fixing bugs in your embedded application.
Practical Examples
This section provides a hands-on, step-by-step guide to setting up and using a remote debugging workflow. We will write a simple C++ program, cross-compile it, and debug it on the Raspberry Pi 5 from VS Code running on a host machine.
%%{init: {'theme': 'base', 'themeVariables': { 'fontFamily': 'Open Sans'}}}%%
graph TD
    subgraph Host Machine
        A[<b>1. Write C/C++ Code</b><br>Create main.cpp in VS Code]
        B[<b>2. Cross-Compile w/ Debug Symbols</b><br><i>aarch64-linux-gnu-g++ -g ...</i>]
        C[<b>3. Deploy to Target</b><br><i>scp ./remote_app pi@rpi_ip</i>]
        D{<b>4. Configure VS Code</b><br>Create launch.json file}
        E[<b>5. Start Debugging Session</b><br>Launch GDB client from VS Code]
    end

    subgraph Network
        F[TCP/IP Connection]
    end

    subgraph "Target (Raspberry Pi 5)"
        G[<b>6. Launch App with GDBServer</b><br><i>gdbserver :1234 ./remote_app</i>]
        H{<b>7. GDBServer Listens</b><br>Waits for client connection}
        I[<b>8. Control & Debug</b><br>Application is paused/controlled<br>by host debugger]
    end

    A --> B;
    B --> C;
    C --> G;
    D --> E;
    E -- GDB Remote Protocol --> F;
    F -- Connects to --> H;
    G --> H;
    H <--> I;
    E <--> I;

    classDef start fill:#1e3a8a,stroke:#1e3a8a,stroke-width:2px,color:#ffffff;
    classDef process fill:#0d9488,stroke:#0d9488,stroke-width:1px,color:#ffffff;
    classDef decision fill:#f59e0b,stroke:#f59e0b,stroke-width:1px,color:#ffffff;
    classDef system fill:#8b5cf6,stroke:#8b5cf6,stroke-width:1px,color:#ffffff;
    classDef success fill:#10b981,stroke:#10b981,stroke-width:2px,color:#ffffff;

    class A,B,C,D,E start;
    class G,H process;
    class I success;
    class F system;
Prerequisites:
- A host development machine (Linux is recommended for simplicity).
- A Raspberry Pi 5 running the official Raspberry Pi OS (64-bit).
- Both the host and the Raspberry Pi 5 are connected to the same local network.
- VS Code installed on the host machine with the
ms-vscode.cpptoolsextension.
Step 1: Prepare the Host Machine
First, we need to install the AArch64 cross-compilation toolchain, which includes the necessary compiler and GDB client.
On a Debian/Ubuntu-based host system, you can install the toolchain with the following command:
sudo apt update
sudo apt install g++-aarch64-linux-gnu gdb-multiarch
g++-aarch64-linux-gnu: The C++ cross-compiler for the 64-bit ARM architecture.gdb-multiarch: A version of GDB capable of debugging multiple architectures, including AArch64.
Step 2: Prepare the Target (Raspberry Pi 5)
On the Raspberry Pi 5, we only need to install GDBServer. It’s a small package and can be installed directly from the Raspberry Pi OS repositories.
Log in to your Raspberry Pi 5 (e.g., via SSH) and run:
sudo apt update
sudo apt install gdbserver
That’s it. The target is now ready to run our application and wait for a debugger connection. Make a note of your Raspberry Pi’s IP address. You can find it by running hostname -I.
Step 3: Create a Sample C++ Application
On your host machine, create a new directory for our project.
mkdir ~/rpi5-gdb-test
cd ~/rpi5-gdb-test
Inside this directory, create a C++ source file named main.cpp. This program will perform a simple calculation in a loop, simulating a long-running task in an embedded application.
// main.cpp
#include <iostream>
#include <vector>
#include <numeric>
#include <thread>
#include <chrono>

// A function to perform a dummy calculation
long long perform_calculation(int count) {
    std::vector<long long> data(count);
    // Fill the vector with some values
    for(int i = 0; i < count; ++i) {
        data[i] = i * 2;
    }

    // Sum the elements
    long long sum = std::accumulate(data.begin(), data.end(), 0LL);
    return sum;
}

int main() {
    int iteration = 0;
    long long result = 0;
    std::cout << "Starting remote debugging test application." << std::endl;

    while (true) {
        iteration++;
        std::cout << "Iteration: " << iteration << std::endl;

        result = perform_calculation(iteration * 100);

        std::cout << "Calculation result: " << result << std::endl;

        // A small delay to simulate a real-world loop
        std::this_thread::sleep_for(std::chrono::seconds(2));
    }

    return 0;
}
Step 4: Cross-Compile the Application
Now, we will compile this code using our cross-compiler. The key is to include the -g flag to add the debugging symbols.
From your project directory (~/rpi5-gdb-test) on the host machine, run the following command:
aarch64-linux-gnu-g++ -g -o remote_app main.cpp -static
aarch64-linux-gnu-g++: The cross-compiler.-g: The crucial flag to include DWARF debugging symbols.-o remote_app: Specifies the output executable file name.main.cpp: Our source file.-static: This links the C++ standard library statically. This is a useful trick in embedded development to avoid issues with mismatched shared library versions between the host toolchain and the target system. It creates a larger executable but makes it self-contained.
After this command, you will have an executable file named remote_app. You can verify it’s for the correct architecture:
file remote_app
The output should be similar to:
remote_app: ELF 64-bit LSB executable, ARM aarch64, version 1 (SYSV), statically linked, … with debug_info, not stripped
Step 5: Deploy and Run on the Target
Next, we need to copy the compiled executable to the Raspberry Pi 5. We can use scp for this. Replace <rpi_ip_address> with your Pi’s actual IP address.
scp ./remote_app pi@<rpi_ip_address>:~/
Now, SSH into your Raspberry Pi. Once logged in, use gdbserver to launch the application.
# On the Raspberry Pi 5
gdbserver :1234 ./remote_app
gdbserver: The program we are running.:1234: This tells GDBServer to listen on all network interfaces on port1234../remote_app: The application to run and debug.
After running this command, GDBServer will start, launch remote_app, and print a message like this, indicating it is waiting for a connection:
Process ./remote_app created; pid = 12345
Listening on port 1234
The application is now paused, waiting for your GDB client to connect and tell it what to do.
Step 6: Configure VS Code for Remote Debugging
Back on your host machine, open the ~/rpi5-gdb-test folder in VS Code.
- Go to the “Run and Debug” view (the icon with the bug and play button on the sidebar).
- Click on “create a launch.json file”.
- When prompted, select “C++ (GDB/LLDB)”.
- VS Code will create a
.vscode/launch.jsonfile. Replace its contents with the following configuration. Be sure to replace<rpi_ip_address>with your Pi’s IP.
// .vscode/launch.json
{
    "version": "0.2.0",
    "configurations": [
        {
            "name": "RPi5 Remote Debug",
            "type": "cppdbg",
            "request": "launch",
            "program": "${workspaceFolder}/remote_app",
            "args": [],
            "stopAtEntry": true,
            "cwd": "${workspaceFolder}",
            "environment": [],
            "externalConsole": false,
            "MIMode": "gdb",
            "miDebuggerPath": "/usr/bin/gdb-multiarch",
            "miDebuggerServerAddress": "<rpi_ip_address>:1234",
            "setupCommands": [
                {
                    "description": "Enable pretty-printing for gdb",
                    "text": "-enable-pretty-printing",
                    "ignoreFailures": true
                }
            ],
            "sourceFileMap": {
                "/path/on/build/machine": "${workspaceFolder}"
            }
        }
    ]
}
Let’s break down this configuration:
"name": A descriptive name that will appear in the debug dropdown menu."program": The path to the executable on the host machine. This is essential for GDB to find the source code and symbols."stopAtEntry": true: This tells the debugger to pause execution as soon as it connects, right at the entry point of the program. This is very useful."MIMode": "gdb": Specifies that we are using GDB."miDebuggerPath": The path to our cross-platform GDB client."miDebuggerServerAddress": The critical setting. This tells GDB where to find GDBServer—the IP address and port of our Raspberry Pi.
Step 7: Start the Debugging Session
Now for the rewarding part.
- Set a breakpoint in
main.cpp. Click in the gutter to the left of the lineresult = perform_calculation(iteration * 100);. A red dot will appear. - In the “Run and Debug” view, ensure “RPi5 Remote Debug” is selected in the dropdown.
- Click the green “Start Debugging” play button (or press F5).
VS Code will now launch gdb-multiarch, connect to the GDBServer on your Pi, and the program will pause at the entry point. Press the “Continue” (F5) button in the debug toolbar. The program on the Pi will run until it hits your breakpoint.

You are now in a live remote debugging session!
- Inspect Variables: Look at the “VARIABLES” panel on the left. You can see the current value of
iteration(it should be 1). - Step Over: Click the “Step Over” button (F10). The line will execute on the Pi, and the debugger will pause on the next line. The value of
resultwill now be updated in the variables panel. - Step Into: If you were on a function call, “Step Into” (F11) would take you inside that function’s code.
- Continue: Click “Continue” (F5) to let the program run freely until it hits the breakpoint again in the next loop iteration. You will see
iterationbecome 2.
You have successfully set up a professional remote debugging environment. You can now analyze and control your embedded application’s execution with precision, all from the comfort of a powerful graphical interface.
Common Mistakes & Troubleshooting
Even with a guide, setting up a remote debugging workflow can be tricky. Here are some common pitfalls and how to solve them.
Exercises
- Conditional Breakpoint:
- Objective: Learn to use conditional breakpoints to stop only when a specific condition is met.
- Task: In the
main.cppsample, the program loops indefinitely. Modify the debugging session to only break when theiterationvariable is exactly5. - Guidance: Right-click on the breakpoint in VS Code and select “Edit Breakpoint…”. Choose “Expression” and enter
iteration == 5. Start the debugging session and press “Continue”. The program should run without stopping until the fifth iteration. - Verification: Check the value of
iterationin the VARIABLES panel when the debugger halts. It should be 5.
- Modifying Variables Mid-Execution:
- Objective: Understand how to manipulate the program’s state during a debugging session.
- Task: Break inside the
whileloop. Before theperform_calculationfunction is called, manually change the value of theiterationvariable to50. - Guidance: When paused at the breakpoint, find the
iterationvariable in the VARIABLES panel. Right-click it, select “Set Value”, and enter50. - Verification: Step over the
perform_calculationcall and observe the console output on the Pi. It should print “Iteration: 50” and the corresponding large calculation result, even if it was on a much earlier iteration.
- Debugging a Segmentation Fault:
- Objective: Use the remote debugger to find the cause of a common memory error.
- Task: Create a new C++ file with a function that intentionally writes to a null pointer. Cross-compile, deploy, and run it with
gdbserver. Connect with VS Code and identify the exact line causing the crash. - Guidance: Write a function like
void crash_me() { int* p = nullptr; *p = 10; }and call it frommain. When you run the program under GDBServer and connect, the program will halt on the offending line. - Verification: The debugger should stop execution and highlight the line
*p = 10;. The “CALL STACK” panel will show the sequence of calls that led to the crash.
- Inspecting the Call Stack:
- Objective: Learn to navigate the call stack to understand program flow.
- Task: Create a program with a chain of nested function calls (e.g.,
maincallsfuncA,funcAcallsfuncB,funcBcallsfuncC). Set a breakpoint insidefuncC. - Guidance: When the breakpoint is hit, examine the “CALL STACK” panel in VS Code.
- Verification: The panel should display the stack frames for
funcC,funcB,funcA, andmain. Clicking on each frame should update the VARIABLES panel to show the local variables for that function’s scope.
- Multi-threaded Debugging:
- Objective: Use the debugger to inspect the state of multiple threads.
- Task: Modify the sample application to have two worker threads, each running its own calculation loop. Set breakpoints in both threads.
- Guidance: Use the C++
<thread>library to create two threads. When a breakpoint is hit, examine the “CALL STACK” panel. It will have a dropdown menu allowing you to switch between threads. - Verification: You should be able to select different threads and see their individual call stacks and local variable states. This demonstrates the debugger’s ability to manage complex, concurrent applications.
Summary
- Remote debugging is a fundamental technique in embedded systems development, allowing you to debug an application on a target device from a host computer.
- The GDB client-server model is the core of this process. The GDB client runs on the host, managing symbols and the user interface, while the lightweight GDBServer runs on the target, controlling the application.
- A cross-compiler is required to build an executable for the target’s architecture (AArch64) on the host’s architecture (e.g., x86-64). The
-gflag is essential for including debug symbols. - Visual Studio Code acts as a powerful graphical front-end for GDB, simplifying the debugging process through its
launch.jsonconfiguration and intuitive UI for breakpoints, stepping, and variable inspection. - The setup process involves installing the cross-compiler and
gdb-multiarchon the host,gdbserveron the target, and configuring VS Code’slaunch.jsonwith the target’s IP address and the path to the host-side executable. - Troubleshooting remote debugging sessions often involves checking for network issues, ensuring executables are synchronized, and verifying file permissions.
Further Reading
- GDB Documentation: The official and most authoritative source for all GDB commands and features.
- GDB Remote Serial Protocol: For those interested in the low-level details of the communication between GDB and GDBServer.
- Visual Studio Code Docs – C++ Debugging: Official documentation for configuring the C/C++ extension.
- Raspberry Pi Foundation Documentation: Official hardware and software documentation for the Raspberry Pi.
- ARM Developer Documentation: In-depth technical manuals and architecture specifications for the ARM processors used in the Raspberry Pi.
- “Mastering Embedded Linux Programming” by Chris Simmonds: An excellent book covering a wide range of embedded Linux topics, including debugging and toolchains.
- “Embedded Linux Systems with the Yocto Project” by Rudolf J. Streif: While focused on Yocto, it contains excellent explanations of concepts like cross-compilation and application development relevant to any embedded Linux workflow.
