
Chapter 44: Debugging Techniques: Overview and Common Strategies
Chapter Objectives
By the end of this chapter, you will be able to:
- Understand the fundamental principles of debugging in a resource-constrained embedded Linux environment.
- Implement effective debugging strategies using print statements and structured logging with
systemd-journald. - Utilize assertions to enforce program invariants and catch logical errors during development.
- Configure and conduct a remote debugging session on a Raspberry Pi 5 using GDB and a graphical front-end like VS Code.
- Identify and troubleshoot common issues related to cross-compilation, debug symbols, and network connectivity.
- Apply a systematic approach to diagnosing and resolving software defects in embedded applications.
Introduction
The moment a program is deployed onto hardware is when the true test begins in embedded systems. Unlike desktop software, which runs in a predictable and forgiving environment, embedded code must contend with the unforgiving realities of physical hardware, real-time constraints, and limited resources. It is here, at the intersection of software and hardware, that bugs often manifest in the most cryptic ways. A sensor might return unexpected values, a motor might stutter, or the entire system might lock up without an obvious cause. Simply put, debugging is not just a phase of development in embedded Linux; it is a core competency, an essential skill that separates a functional prototype from a reliable product.
This chapter provides a foundational overview of the most common and effective debugging strategies used in embedded Linux development. We will move from the simplest techniques to the most powerful, starting with the ubiquitous print statement—a tool as old as programming itself, yet still indispensable. From there, we will graduate to structured logging, a more robust method for creating a detailed narrative of your program’s execution that can be analyzed long after an event has occurred. We will then explore assertions, a proactive method for catching impossible situations before they corrupt the system. Finally, we will dedicate significant attention to the GNU Debugger (GDB), the industry-standard tool for peering into the soul of a running program. You will learn how to use GDB in a remote, cross-platform environment, allowing you to control and inspect an application running on your Raspberry Pi 5 from the comfort of your development machine. By mastering these techniques, you will gain the confidence to tackle the inevitable bugs that arise and build more stable, predictable, and robust embedded systems.
Technical Background
The Philosophy of Debugging
Before diving into specific tools, it is crucial to adopt the correct mindset. Debugging is a scientific process. It begins with an observation—the system is not behaving as expected. The next step is to form a hypothesis about the cause. What could lead to this erroneous behavior? Your goal is then to devise an experiment to test this hypothesis. This is where tools like print statements and debuggers come in. They are your instruments for gathering data. Based on the data you collect, you either confirm your hypothesis and implement a fix, or you refute it and form a new one. This iterative cycle of observation, hypothesis, and experimentation is the very essence of effective debugging. The tools we are about to discuss are merely facilitators of this scientific method.

From printf to Structured Logging: A Tale of Two Outputs
The Humble printf: A Double-Edged Sword
The simplest and most intuitive debugging tool is the print statement. In C, this is the venerable printf() function; in Python, it’s print(). The concept is straightforward: if you want to know the value of a variable at a certain point in your code, you print it to the console. If you want to know if a particular block of code is being executed, you print a message from within it.
// A simple C example of using printf for debugging
int sensor_value = read_temperature_sensor();

printf("DEBUG: Sensor value read as %d\n", sensor_value);

if (sensor_value > THRESHOLD) {
    printf("DEBUG: Threshold exceeded! Activating fan.\n");
    activate_fan();
}
This approach is powerful in its simplicity and requires no special setup. However, its simplicity is also its greatest weakness, especially in an embedded context. First, printf statements are indiscriminate. They print everything you tell them to, every single time the code runs. This can lead to a deluge of information, a phenomenon often called “printf-spam,” making it difficult to find the one piece of information you actually need.
Second, and more critically for embedded systems, I/O operations are slow. Writing to a serial console or an SSH terminal takes a significant number of CPU cycles. In a time-sensitive application, such as one controlling a motor or processing a real-time data stream, the act of printing a debug message can alter the timing of the program. This can cause the bug you are hunting to disappear, only to reappear the moment you remove the printf statement. This is a classic example of a “Heisenbug”—a bug that changes its behavior when you try to observe it.
Furthermore, printf output is ephemeral. It scrolls by on a terminal and is lost unless you manually redirect it to a file. There is no built-in mechanism for filtering messages by severity, timestamping them, or saving them for later analysis. Once you are done debugging, you are faced with the tedious and error-prone task of removing or commenting out all the printf statements you added. For these reasons, while printf is excellent for a quick check, it is not a sustainable strategy for long-term development or for debugging complex systems.
The Rise of Structured Logging: syslog and journald
To overcome the limitations of simple print statements, operating systems developed logging daemons. A daemon is a background process that provides services to other applications. A logging daemon’s job is to accept log messages from various programs, enrich them with metadata like timestamps and source application names, and write them to a central, persistent location.
For many years, the standard logging system on Linux was syslog. Applications would send messages to the syslog daemon, which would then, based on a set of rules in /etc/syslog.conf, write them to files in the /var/log directory (e.g., /var/log/messages). This was a significant improvement. It decoupled the act of generating a message from the act of writing it, provided a central repository for all system logs, and allowed for basic filtering based on “facility” (the type of program logging the message) and “priority” (the severity of the message).
However, modern Linux distributions, including Raspberry Pi OS, have largely moved to a more advanced system: the systemd journal, managed by the journald daemon. The journal is a fundamental leap forward. Unlike syslog‘s plain text files, the journal stores log data in a structured, indexed binary format. This offers several powerful advantages:
- Rich Metadata: Every log entry is automatically stamped with dozens of fields, including the timestamp with microsecond precision, the user and group ID of the process, the process ID (PID), and the name of the executable.
- Powerful Filtering: The
journalctlutility can query the journal using any of these fields. You can ask to see all messages from a specific executable, all messages with a certain priority level (e.g., “error”), or all messages that occurred within a specific time window. - Performance: Writing to the binary journal is often faster than writing to a text file, reducing the performance impact on your application.
- Integration: The journal is deeply integrated with the
systemdinit system, which manages services on the Raspberry Pi. This means you can easily view all the log output generated by a specific service you have created.
When you use structured logging, you are no longer just printing a string; you are submitting a structured record of an event.
%%{init: {'theme': 'base', 'themeVariables': { 'fontFamily': 'Open Sans'}}}%%
sequenceDiagram
    actor App as Application<br>(sensor_app)
    participant Jd as journald Daemon
    participant JF as Binary Journal<br>(/var/log/journal)
    actor User

    App->>+Jd: sd_journal_print(LOG_WARNING, "High temp: %.2f", 31.5);
    Jd->>Jd: Add Metadata<br>Timestamp, PID, UID,<br>Executable Name, etc.
    Jd->>+JF: Write Structured<br>Binary Entry
    JF-->>-Jd: Acknowledge Write
    Jd-->>-App: Return

    User->>+User: journalctl -p warning<br>/home/pi/sensor_app
    User-->>JF: Query Journal
    JF-->>User: Return Formatted<br>Matching Log Entries
An application can send messages to the journal using the sd_journal_print() function from the libsystemd library. This function works similarly to printf but directs the output to journald and allows you to specify a priority level, such as LOG_DEBUG, LOG_INFO, LOG_WARNING, or LOG_ERR. This allows you to leave detailed debugging messages in your code but configure journald to only record messages above a certain severity (e.g., LOG_INFO and higher) in a production environment, effectively turning off your debug spam without recompiling your code.
Assertions: Enforcing Contracts in Code
While logging helps you understand what happened after the fact, assertions help you prevent errors from happening in the first place. An assertion is a statement that declares a condition that you, the programmer, believe to be true at a certain point in the program. If that condition turns out to be false, the program immediately terminates with an error message.
In C, this is done with the assert() macro, which is defined in <assert.h>.
#include <assert.h>

void set_motor_speed(int speed) {
    // The motor speed should never be negative or exceed the maximum.
    assert(speed >= 0 && speed <= 255);

    // ... code to set the motor speed ...
}
In this example, the assert() statement acts as a contract for the set_motor_speed function. It enforces the rule that the speed parameter must be within the valid range of 0 to 255. If another part of the program mistakenly calls this function with a value of -1 or 300, the assertion will fail, and the program will halt, printing a message that indicates exactly which assertion failed (including the filename and line number).
This “fail-fast” approach is incredibly valuable during development. It catches logical errors the moment they occur, rather than allowing the invalid data to propagate through the system, potentially causing a much more obscure crash or incorrect behavior later on. It points directly to the source of the violated assumption.
A key feature of assertions is that they are typically only active in debug builds. When you compile your code for release, you define the NDEBUG (No Debug) macro, which causes the assert() macro to expand to nothing. The compiler effectively removes all assertion checks from the final production binary. This means you get the safety benefits during development without any performance penalty in the finished product.
Tip: Use assertions to check for things that should be impossible. They are not for handling expected errors, like a file not being found or a network connection failing. For those, you should use proper error handling with
ifstatements and return codes. Assertions are for catching programmer errors—violations of your own logic.
The Power of Interactive Debugging: GDB
Logging and assertions are passive forms of debugging. You analyze the data after the program has run or crashed. An interactive debugger, like the GNU Debugger (GDB), is an active tool. It gives you god-like control over your program’s execution. You can pause it at any point, inspect its state, and then continue execution, stepping through the code line by line.
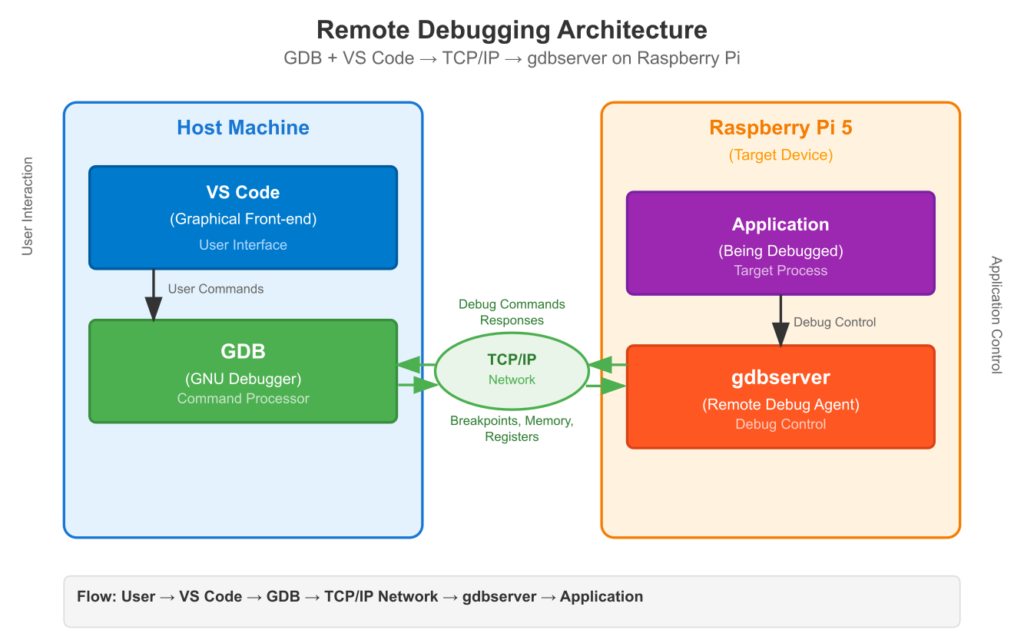
For embedded systems, this process is almost always done remotely. Running a full-featured debugger on a resource-constrained device like a Raspberry Pi is often impractical. Instead, we use a client-server model. A small, lightweight program called gdbserver runs on the target device (the Raspberry Pi). Your full-featured debugger, gdb, runs on your powerful host development machine (your laptop or desktop). The two communicate over a network connection (Ethernet or Wi-Fi).
%%{init: {'theme': 'base', 'themeVariables': { 'fontFamily': 'Open Sans'}}}%%
graph TD
    subgraph "Host Machine (x86-64)"
        A[<br><b>Developer</b><br>Writes C/C++ Code<br>]
        B{Cross-Compile<br>with -g flag}
        C["Executable<br>(with Debug Symbols)"]
        D[VS Code +<br>C/C++ Extension]
        E(gdb-multiarch<br>Client)

        A --> B;
        B --> C;
        C --> D;
        D -- Controls --> E;
    end

    subgraph "Target Device (Raspberry Pi 5 - ARM64)"
        F["Executable<br>(copied from Host)"]
        G(gdbserver)
        H{Application<br>Under Debug}

        F -- Loaded by --> G;
        G -- Attaches to --> H;
    end

    subgraph "Network (TCP/IP)"
        direction LR
        I((<br>))
    end

    C -- "scp" --> F;
    E -- "target remote<br>pi_ip:port" --> I;
    I -- "Commands<br>Responses" --> G;


    classDef host fill:#1e3a8a,stroke:#1e3a8a,stroke-width:2px,color:#ffffff
    classDef target fill:#8b5cf6,stroke:#8b5cf6,stroke-width:1px,color:#ffffff
    classDef process fill:#0d9488,stroke:#0d9488,stroke-width:1px,color:#ffffff
    classDef network fill:#f59e0b,stroke:#f59e0b,stroke-width:1px,color:#ffffff
    classDef file fill:#374151,stroke:#374151,stroke-width:1px,color:#ffffff

    class A,D,E host
    class F,G,H target
    class B,C process
    class I network
To make this work, a few things must be in place. First, your application must be compiled with debug symbols. When you compile a program, the compiler translates your human-readable C code into machine code. It also creates a symbol table that maps variable names, function names, and line numbers to specific memory addresses in the machine code. By default, to save space, this symbol table is discarded. To tell the compiler to keep it, you must pass the -g flag. Without debug symbols, GDB can still control your program, but it can’t tell you that you are on line 42 of main.c or what the current value of the sensor_value variable is; it can only speak in terms of raw memory addresses and processor registers.
Second, you need a cross-compiler. Your host machine (likely with an x86-64 processor) cannot create an executable that will run on the Raspberry Pi’s ARM-based processor. A cross-compiler is a special version of the GCC compiler that runs on your host but generates code for the target’s architecture.
The remote debugging workflow looks like this:
- Cross-compile: On your host machine, you use the cross-compiler with the
-gflag to build your application. - Deploy: You copy the compiled executable from your host machine to the Raspberry Pi.
- Start
gdbserver: On the Raspberry Pi, you launchgdbserver, telling it which program to run and on which network port to listen for a connection. - Start GDB Client: On your host machine, you launch
gdb(often through a graphical interface like VS Code). You tell it two things: where to find the local copy of the executable with its symbol table, and the IP address and port of thegdbserverrunning on the Pi. - Connect and Debug: GDB connects to
gdbserver. Now you have full control.
Once connected, you can use GDB’s core commands:
break <location>: Set a breakpoint. A breakpoint tells the debugger to pause execution whenever it reaches a specific line of code or function. For example,break mainwill stop the program at the beginning of themainfunction.run: Start the program’s execution. It will run until it hits a breakpoint or the program terminates.continue: Resume execution after the program has been paused at a breakpoint.next: Execute the current line of code and then pause again on the next line. If the current line is a function call, it executes the entire function without stepping into it.step: Similar tonext, but if the current line is a function call, it will step into that function and pause on its first line.print <variable>: Display the current value of a variable.watch <variable>: Set a watchpoint. A watchpoint will pause execution whenever the value of a specific variable changes, regardless of where in the code that change occurs. This is incredibly powerful for tracking down where a variable is being corrupted.backtrace: Display the call stack, showing the chain of function calls that led to the current point of execution. This is essential for understanding the context of a crash.
Using GDB provides the deepest possible insight into your program’s behavior, allowing you to test hypotheses about program flow and state with surgical precision.
Practical Examples
This section provides hands-on examples for the Raspberry Pi 5. We assume you have a host Linux machine (or a VM) for cross-compilation and a network connection to your Raspberry Pi 5.
Example 1: printf and Structured Logging
Let’s start with a simple C program that simulates reading a temperature and humidity sensor. We will first debug it with printf and then convert it to use systemd‘s journal for structured logging.
Step 1: Create the C Source File
On your host machine, create a file named sensor_app.c.
// sensor_app.c
#include <stdio.h>
#include <unistd.h>
#include <stdlib.h>
#include <time.h>

// Use the systemd journal library for logging
#include <systemd/sd-journal.h>

// Simulate reading from a sensor
float get_temperature() {
    // Return a random temperature between 15.0 and 35.0
    return 15.0f + (rand() / (RAND_MAX / 20.0f));
}

int main(void) {
    // Seed the random number generator
    srand(time(NULL));

    printf("Sensor monitoring application starting.\n");

    for (int i = 0; i < 10; i++) {
        float temp = get_temperature();

        // --- Original printf debugging ---
        // printf("DEBUG: Current temperature is %.2f C\n", temp);

        // --- Structured logging version ---
        sd_journal_print(LOG_INFO, "Current temperature is %.2f C", temp);

        if (temp > 30.0f) {
            // printf("WARN: Temperature is high!\n");
            sd_journal_print(LOG_WARNING, "High temperature event: %.2f C", temp);
        }

        sleep(1); // Wait for 1 second
    }

    printf("Sensor monitoring application finished.\n");
    sd_journal_print(LOG_INFO, "Application finished.");

    return 0;
}
Step 2: Cross-Compile the Application
First, you need a cross-compiler toolchain for the Raspberry Pi’s architecture (AArch64). You can install it on a Debian/Ubuntu host with:
sudo apt update
sudo apt install crossbuild-essential-arm64
Now, compile the code. The aarch64-linux-gnu-gcc command is our cross-compiler. We need to link against the systemd library using -lsystemd.
aarch64-linux-gnu-gcc -o sensor_app sensor_app.c -lsystemd
Step 3: Deploy and Run on Raspberry Pi 5
Copy the compiled binary to your Pi using scp. Replace pi_ip_address with your Pi’s actual IP address.
scp sensor_app pi@pi_ip_address:~/
Now, SSH into your Pi and run the application:
ssh pi@pi_ip_address
chmod +x sensor_app
./sensor_app
You will see the printf output directly in your terminal. Now, let’s look at the structured logs.
Step 4: View the Logs with journalctl
The sd_journal_print calls sent messages to the journal. You can view them with journalctl. To see the logs specifically from our executable:
journalctl /home/pi/sensor_app
The output will be much richer than the printf output:
Jul 08 20:45:19 raspberrypi sensor_app[1234]: Current temperature is 22.75 C
Jul 08 20:45:20 raspberrypi sensor_app[1234]: Current temperature is 31.50 C
Jul 08 20:45:20 raspberrypi sensor_app[1234]: High temperature event: 31.50 C
Jul 08 20:45:21 raspberrypi sensor_app[1234]: Current temperature is 18.90 C
...
Jul 08 20:45:28 raspberrypi sensor_app[1234]: Application finished.
Notice the timestamps, hostname, executable name (sensor_app), and PID (1234) are all added automatically. We can also filter by priority. To see only warnings and more severe messages:
journalctl -p warning /home/pi/sensor_app
This command would only show the “High temperature event” lines, demonstrating the power of filtering.
Example 2: Remote Debugging with GDB and VS Code
Now for the main event. We will debug a simple but buggy program remotely. The program is supposed to calculate the factorial of a number, but it contains a common off-by-one error.
Step 1: Create the Buggy Source File
On your host machine, create buggy_app.c:
// buggy_app.c
#include <stdio.h>
#include <stdlib.h>

long factorial(int n) {
    long result = 1;
    // BUG: The loop condition should be i <= n, not i < n.
    for (int i = 1; i < n; i++) {
        result *= i;
    }
    return result;
}

int main(int argc, char *argv[]) {
    if (argc < 2) {
        printf("Usage: %s <number>\n", argv[0]);
        return 1;
    }

    int num = atoi(argv[1]);
    long fact = factorial(num);

    printf("The factorial of %d is %ld\n", num, fact);

    return 0;
}
Step 2: Cross-Compile with Debug Symbols
We use the same cross-compiler, but this time we add the crucial -g flag to include debug information.
aarch64-linux-gnu-gcc -g -o buggy_app buggy_app.c
Step 3: Deploy and Start gdbserver on the Pi
Copy the file to the Pi as before:
scp buggy_app pi@pi_ip_address:~/
Now, SSH into the Pi and start gdbserver. We’ll tell it to run our buggy_app with the command-line argument 5 and listen for connections on port 9090.
ssh pi@pi_ip_address
chmod +x buggy_app
gdbserver :9090 ./buggy_app 5
The output will be:
Process ./buggy_app created; pid = 2345
Listening on port 9090
gdbserver is now waiting for a GDB client to connect.
Step 4: Configure VS Code for Remote Debugging
On your host machine, open the folder containing buggy_app.c in VS Code.
1. Install the C/C++ extension from Microsoft.
2. Go to the “Run and Debug” view (the bug icon on the left).
3. Click “create a launch.json file” and select “C++ (GDB/LLDB)”.
4. Replace the contents of the generated `launch.json` with the following configuration:
{
    "version": "0.2.0",
    "configurations": [
        {
            "name": "Remote Debug Raspberry Pi",
            "type": "cppdbg",
            "request": "launch",
            "program": "${workspaceFolder}/buggy_app", // Path to the executable on the HOST
            "args": [],
            "stopAtEntry": false,
            "cwd": "${workspaceFolder}",
            "environment": [],
            "externalConsole": false,
            "MIMode": "gdb",
            "miDebuggerPath": "/usr/bin/gdb-multiarch", // Path to GDB with multi-arch support
            "miDebuggerServerAddress": "pi_ip_address:9090", // Pi's IP and port
            "setupCommands": [
                {
                    "description": "Enable pretty-printing for gdb",
                    "text": "-enable-pretty-printing",
                    "ignoreFailures": true
                }
            ]
        }
    ]
}
Warning: You may need to install
gdb-multiarchon your host machine (sudo apt install gdb-multiarch) as it’s designed to debug executables from different architectures. Also, remember to replacepi_ip_addresswith your Pi’s real IP.
Step 5: The Debug Session
- Set a Breakpoint: Open
buggy_app.c. Click in the gutter to the left of the line number for thereturn result;line inside thefactorialfunction. A red dot will appear, indicating a breakpoint. - Launch the Debugger: Go to the “Run and Debug” view, make sure “Remote Debug Raspberry Pi” is selected in the dropdown, and press the green play button.
- Connect: VS Code will launch GDB, which will connect to the
gdbserveron the Pi. The program will start running on the Pi and immediately pause at your breakpoint. The line will be highlighted in yellow. - Inspect Variables: In the “VARIABLES” panel on the left, you will see the local variables. You’ll notice
nis5, butresultis24. The factorial of 5 should be 120. This confirms our hypothesis that the result is wrong. - Find the Bug: Look at the
forloop. You can hover over the variableito see its final value, which will be4. The loop stopped wheniwas no longer less thann(5). It never multiplied by 5. The bug is that the condition should bei <= n. - Stop the Session: Press the red square “Stop” button in the debug toolbar. This will terminate both GDB on the host and the application on the Pi.
You have now successfully used a professional remote debugging setup to find a bug in an embedded application. You can now fix the code (i <= n), recompile, redeploy, and verify the fix.
Common Mistakes & Troubleshooting
Even with powerful tools, debugging can be a frustrating experience. Here are some common pitfalls and how to avoid them.
Exercises
- Log Level Filtering: Modify the
sensor_app.cexample. Add a few more log messages: aLOG_DEBUGmessage inside theget_temperaturefunction and aLOG_CRIT(critical) message if the temperature ever exceeds 34.0 C. Run the application and usejournalctlto perform the following queries:- Show only the critical message.
- Show all messages except for the debug messages.
- Show all messages within the last 5 minutes.
- The
printfHunt: The following code is supposed to reverse a string in place. It has a subtle bug. Without using GDB, addprintfstatements to diagnose and fix the problem. The bug lies in how the pointers are manipulated or the loop termination condition.
// reverse_string.c
#include <stdio.h>
#include <string.h>

void reverse(char *str) {
    char *end = str + strlen(str) - 1;
    char tmp;
    while (end > str) {
        tmp = *str;
        *str = *end;
        *end = tmp;
        str++;
        end--;
    }
}

int main() {
    char my_string[] = "raspberry";
    reverse(my_string);
    printf("Reversed string: %s\n", my_string); // Expected: yrrebpsar
    return 0;
}- Assertion Contracts: Write a C function
set_rgb_color(int r, int g, int b)that simulates setting an RGB LED. Each color component must be between 0 and 255, inclusive. Inside the function, use three separateassert()statements to validate each of ther,g, andbparameters. Write amainfunction that calls this function correctly once and incorrectly once (e.g., with a value of300) to see the assertion fail. Compile and run on the Pi. - GDB Challenge: The
buggy_app.cfactorial example has another potential bug. Thelongtype might not be large enough to hold the factorial of larger numbers (e.g., 21). This is called an integer overflow. Use your remote GDB setup to investigate.- Run the program with the input
25. - Set a breakpoint inside the
forloop. - Step through the loop and use the
print resultcommand in the “DEBUG CONSOLE” to watch the value ofresultas it grows. - Identify the point at which the value suddenly becomes negative or nonsensical. This is the overflow. Explain why this happens.
- Run the program with the input
Summary
- Debugging is a systematic process of forming and testing hypotheses about the cause of a software defect.
printfdebugging is simple and direct but can be intrusive, altering system timing and flooding the console with output.- Structured logging via
systemd-journaldis the modern, robust approach on Linux. It provides automatic metadata, persistent storage, and powerful filtering capabilities usingjournalctl. - Log levels (e.g., DEBUG, INFO, WARNING, ERROR) allow you to control the verbosity of logging without changing the code.
- Assertions (
assert()) are used to define contracts and invariants in your code. They catch “impossible” situations early during development and are compiled out of release builds. - GDB is a powerful interactive debugger that allows you to pause execution, inspect memory and variables, and step through code line-by-line.
- Remote debugging with
gdbandgdbserveris the standard practice for embedded systems, allowing you to debug a target device from a powerful host machine. - Debug symbols (the
-gflag) are essential for GDB to map machine code back to your original source code. Compiling with optimizations disabled (-O0) is critical for a predictable debugging experience.
Further Reading
- GDB Documentation: The official manual for the GNU Debugger is the most authoritative source. https://www.gnu.org/software/gdb/documentation/
- systemd.journal-fields(7) Man Page: A detailed description of all the metadata fields automatically captured by the systemd journal. https://www.man7.org/linux/man-pages/man7/systemd.journal-fields.7.html
- Raspberry Pi Documentation – The C SDK: While focused on Pico, the principles of setting up a toolchain are relevant. https://datasheets.raspberrypi.com/pico/getting-started-with-pico.pdf (See Chapter 9 for debugging).
- “Debugging with GDB” by Richard Stallman, Roland Pesch, Stan Shebs, et al.: A comprehensive book available for free from the Free Software Foundation.
- VS Code Docs – C++ Debugging: Official documentation for configuring the C/C++ extension for various debugging scenarios, including remote. https://code.visualstudio.com/docs/cpp/cpp-debug
- “The Art of Debugging with GDB, DDD, and Eclipse” by Norman Matloff and Peter Jay Salzman: A classic, practical book on the subject.
Meta Description and tags
Meta Description: Debugging embedded Linux systems with the Raspberry Pi 5. Covers printf, logging with journald, assertions, and remote GDB.
Tags:
- Embedded Linux, Raspberry Pi 5, Debugging, GDB, Cross-Compilation, C Programming, Systemd
