
Interactive Signal Analysis Tool
Explore the building blocks of signals by composing and decomposing waves.
Signal Controls
Signal Composition
Any complex signal can be built by adding together simple sine and cosine waves of different properties. These simple waves are called harmonics. Adjust the properties of the harmonics below to see how they combine to create a new, complex waveform in the "Time Domain" plot.
- Amplitude: The height or "strength" of the wave.
- Frequency: How many times the wave repeats per second (in Hertz).
- Phase: The starting position of the wave, shifting it left or right.
Sine Harmonic #1
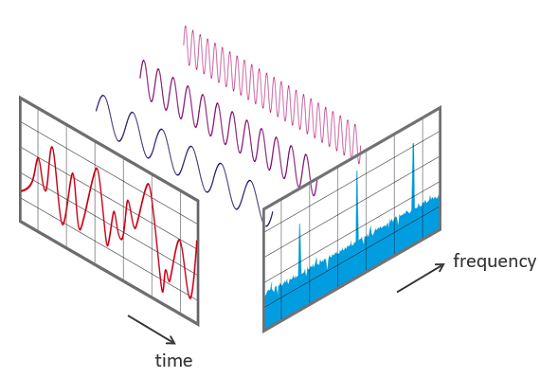
Time Domain
This plot shows the signal's amplitude (strength) as it changes over time. It's the waveform you would see on an oscilloscope. When you add harmonics, you can see them summing up to create the final shape.
Frequency Domain (Spectrum)
This plot, called a spectrum, shows which frequencies are present in the signal and their respective magnitudes (strengths). It's calculated using an algorithm called the Fast Fourier Transform (FFT). Each spike corresponds to a harmonic component of the signal from the time domain plot.
Things to Try
- Build a Square Wave: In "Composition" mode, start with a sine wave (e.g., 5 Hz). Add another sine wave at 3 times the frequency (15 Hz) and 1/3 the amplitude. Add another at 5 times the frequency (25 Hz) and 1/5 the amplitude. See how the waveform starts to look like a square wave!
- See the Spectrum: Switch to the "Square Wave" decomposition mode. Notice the spectrum shows spikes only at odd multiples of the fundamental frequency, just like you were building.
- Phase Matters: Add two sine waves with the same frequency but change the phase of one. See how the overall amplitude changes, demonstrating constructive and destructive interference.
Understanding the Magic of Signals
At its core, every complex signal—from the sound of a musical instrument to a radio wave carrying information—is simply a combination of much simpler waves. The process of breaking down a complex signal into its simple building blocks is called Fourier Analysis, a fundamental concept in engineering and physics.
Our interactive tool lets you experience this powerful idea firsthand. You can act as a signal architect, building your own waveforms by adding simple sine and cosine waves (harmonics). Or, you can do the reverse: take a standard waveform, like a square wave, and see the exact recipe of harmonics that it’s made of.
Why Does This Matter?
Understanding a signal in both its time domain (how it behaves over time) and its frequency domain (what frequencies it contains) is crucial in many fields:
- Audio Engineering: Equalizers (EQs) work by boosting or cutting specific frequency ranges to change the sound of music.
- Telecommunications: Your Wi-Fi router and phone separate different signals based on their unique frequencies to avoid interference.
- Medical Imaging: MRI and CT scans use principles of Fourier analysis to construct detailed images of the human body from raw signal data.
Further Reading
To dive deeper into the fascinating world of signal processing, check out these excellent resources:
- What is the Fourier Transform? – A fantastic and intuitive video explanation by 3Blue1Brown.
- Fourier Analysis on Wikipedia – A comprehensive technical overview of the history and mathematics.
- An Interactive Introduction to Fourier Transforms – Another interactive guide that helps build a visual intuition for the concept.
Check out other labs!:
- Digital Filter Designer
- Interactive Logic Gate Simulator Lab